Community resources
Community resources
Community resources
All you wanted to know about customer support KPIs

When working in customer support, it’s crucial to calculate, analyze and monitor specific numbers, called KPIs (Key Performance Indicators). They go hand-in-hand with customer satisfaction, problem diagnosis, achievement of goals and support contracts.
These are some essential customer support KPIs which should be monitored:
- Service Level Agreements (SLAs)
- Cost per Ticket
- Number of tickets submitted vs. Number of tickets solved
- Time elapsed after ticket submission and first reply by support representative (First Reply Time)
- Time elapsed after ticket submission and first status change by support representative (First Response Time)
What those numbers tell you
SLAs (Service Level Agreements)
Part of customer support are customer support agreements, called Service Level Agreements (SLAs). Tracking those contracted key metrics is essential for the success of customer support teams. Existing contracts could need an update and tracked numbers and successes give a hint on how future contracts should look like. By checking your customer support SLAs you will find out if agreements with your customers have been met.
Some SLA reports are already in system like Jira Service Management by default. You can create SLA reports to see how well your team performs per request type. For example: You may find your team speeding up on responding to customer requests initially, but slowing down on resolving these issues.
SLA reports could track the progress of contracted key figures, for example:
- Respond to all requests within 2 hours
- Resolve high-priority requests within 24 hours
Cost per Ticket
Another IT metric, which could be relevant, is the calculation of your cost per ticket. You’re looking at operating costs of your service desk team as well as the workload and customer satisfaction. By doing so, you can decide whether your customer support is profitable.
Number of created & solved tickets
By having a look at the number of tickets created vs. number of tickets solved and their content, you will be aware of, on the one hand, your team’s workload and capacity needs. On the other hand you will get more insights into your customer’s requests by looking at the ticket’s content. When realizing a huge gap between submitted and solved tickets, you could have a look into your teams efficiency and resources and how to improve it.
First Reply Time
Many customer support teams commit to SLAs (Service Level Agreements) with customers, where they define response/reply times. The elapsed time after ticket submission until a support representative is commenting for the first time is called First Reply Time. By optimizing your First Reply Time you will be able to optimize your customer satisfaction, because it’s quickly visible to customers that they are being heard. The solution itself or the quality of the first reply is not relevant at this point.
First Response Time
To react to incoming requests is only half of the deal. But to provide solutions in customer support is the main goal. By calculating and monitoring your First Response Time, you will be able to find out how quick customer support representatives react to submissions and take care of them. The elapsed time until the First Response will be, for example due to a status change to “In the making”.
What you should pay attention to
- Some metrics as well as common SLAs should be available in your ticket system like Jira Service Management or Zendesk by default.
- Your ticket system should be able to track time stamps of ticket submission and first reactions/comments in order to calculate your First Reply and First Response Time.
- Exclude any automatic responses by your system, which are done as soon as a ticket is being sent in. Simply because they do have no connection to active ticket processing.
- Pay attention to include your business hours and pay attention to time zones, which could change SLAs.
- Use visuals for customer support KPI reports, to give comprehensible context, mark your success and show comparisons, for example to a past period of time.
The calculation
| Calculation of First Response Time | Calculation of First Reply Time |
| Average First Response Time= Sum of elapsed minutes until first response / number of tickets | Average First Reply Time= Sum of elapsed minutes until first status change/ number of tickets |
Alternative calculation: Median | Alternative calculation: Median |
| Median is calculated by choosing the average number, to minimize the influence of extreme values.
Example: | Median is calculated by choosing the average number, to minimize the influence of extreme values. |
Problems of common support systems and reports
Many support systems like Jira Service Management or Zendesk enable to calculate the mentioned KPIs. But oftentimes they do not fulfill the needs to individualize the calculation structure and the layout of results. Furthermore, it can be tricky to add additional factors to the calculation. Professional visualization and exporting or sharing functions are oftentimes not possible as well, but could be important in enterprises.
First Response Time & First Reply Time: Get those numbers with Report Builder
Our reporting app Report Builder is offering the needed solution that common support system have to face.
- In our integrated Report Builder gallery you will be able to find reports like First Reply Time and First Response Time.
- They are available as Scripted Reports, so open-source and customizable templates.
- You will be able to copy them and work on their HTML or JavaScript in a coding framework.
- SLAs could also be visualized in Report Builder.
- We’ve also added exporting functions to PDF, Excel, JSON and Microsoft Teams so far, as well as a sharing option with other Report Builder users, to simplify sharing your reports with team members or stakeholders.
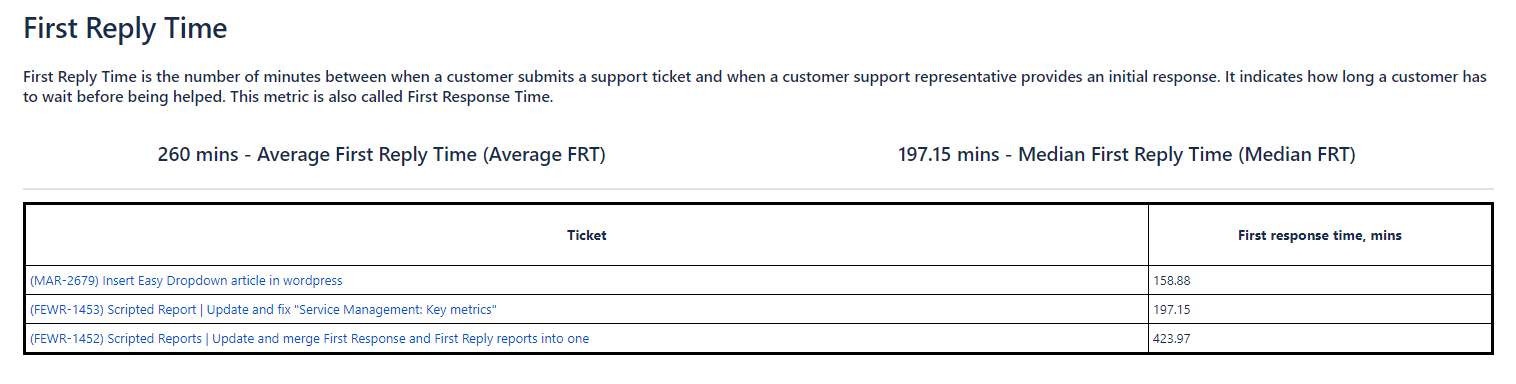
„First Reply Time“ report in Report Builder
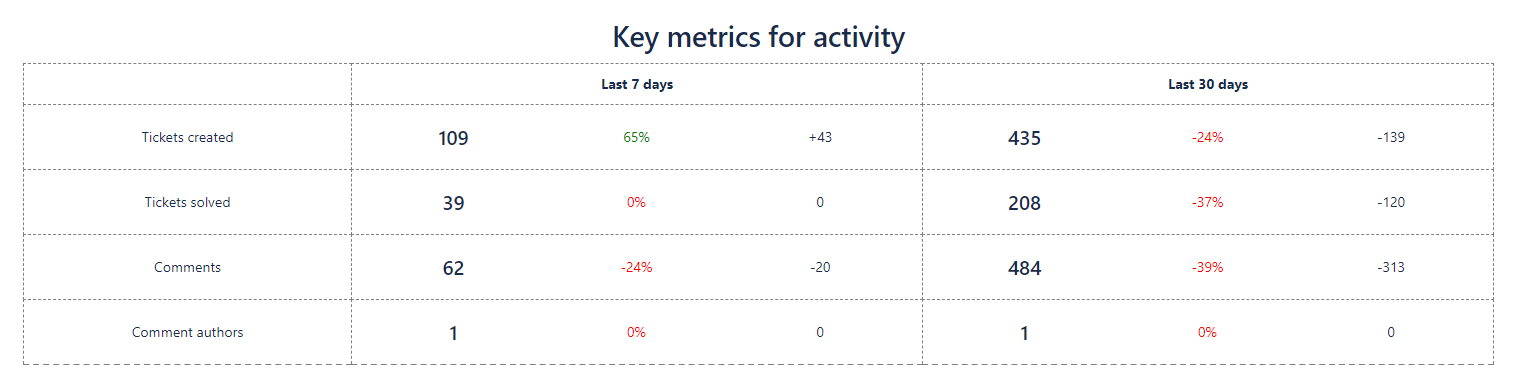
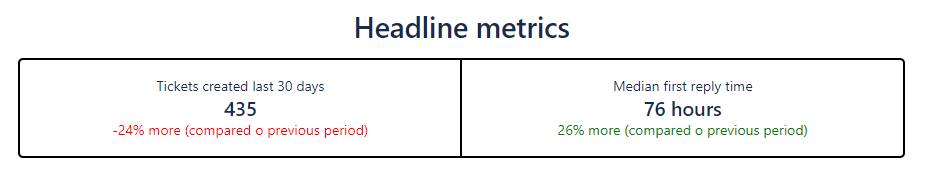
Report Builder reports „Key Metrics for activity“ and „Service Management: Key metrics“
Curious? Test Report Builder for free now!
Was this helpful?
Thanks!
Andrei Pisklenov _Actonic_
3 comments