Community resources
Community resources
Community resources
"Created vs. Resolved" report

"Created vs. Resolved" Report in Report Builder
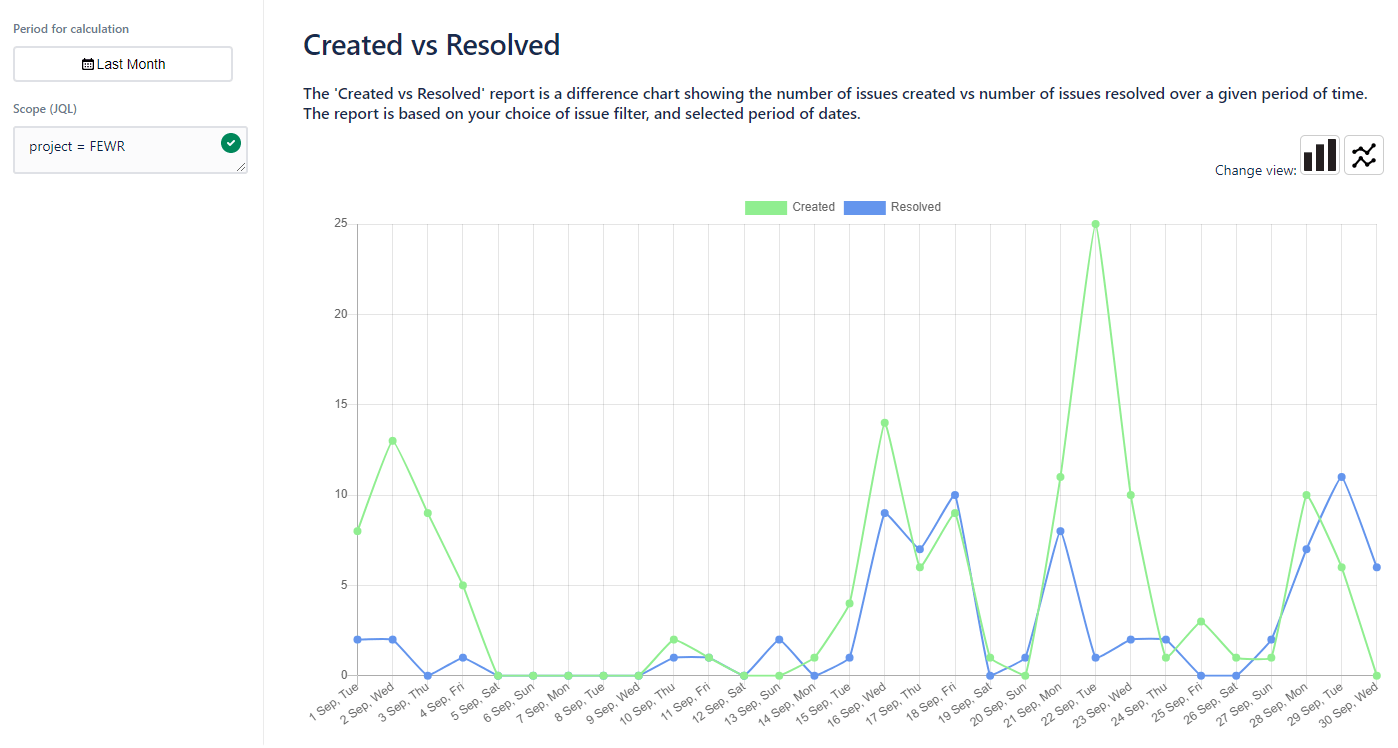
When working in a big project team, it is important to analyze what the workload has been looking like and if the roadmap has been followed. In order to get an overview over these numbers, reports like our Report Builder report “Created vs. Resolved” collect important information. By selecting the respective user, team or project as JQL Scope and by picking the needed dates, the graphs show the relation between created and resolved Jira tickets over a given period of time. The line or bar chart showcase how the productivity changed and if goals have been met. The report is based on your choice of issue filter and the selected timeframe.
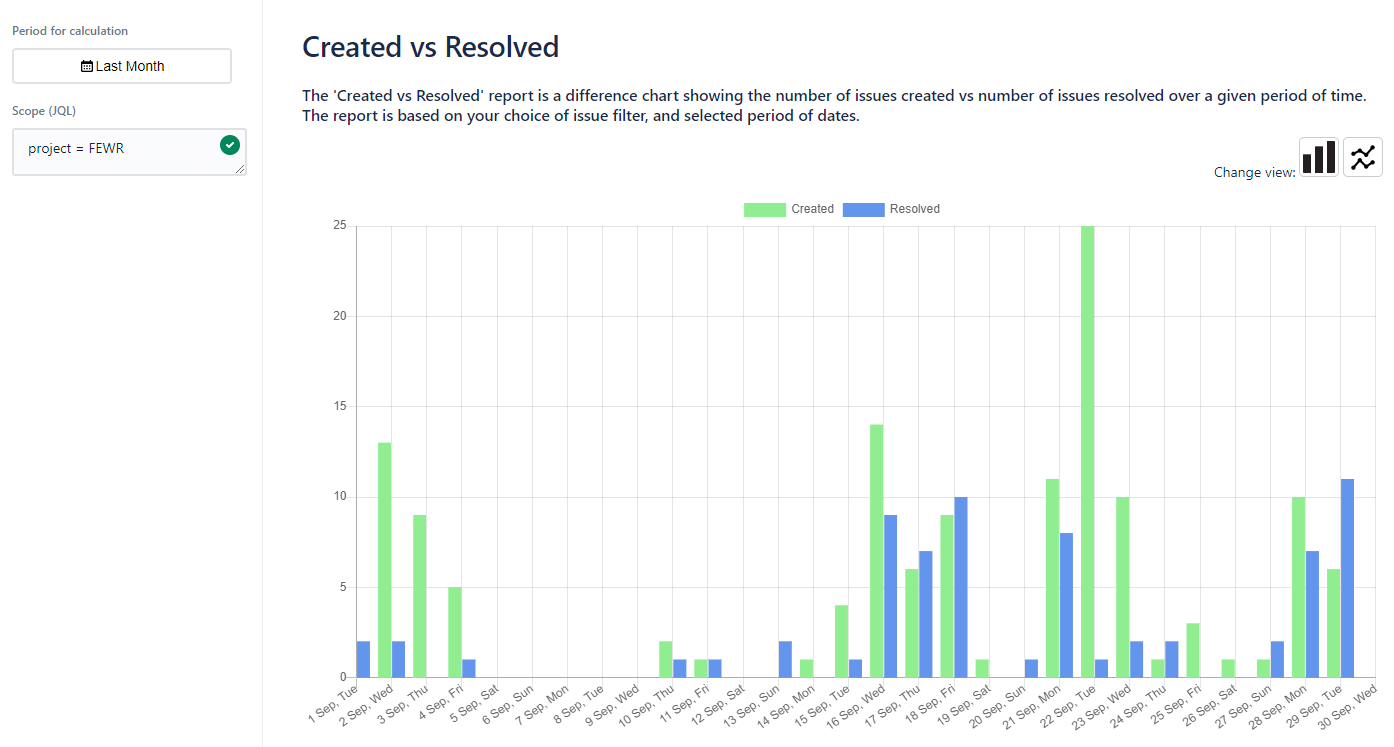
What does the "Created vs Resolved" report look like?
As a line chart:
As a bar chart:
Input parameters
- Period for calculation – a period for report calculation. You can use static dates or relative date like “Last month” or “Last week”.
- Scope (JQL) – a “Jira Query Language” string which represents the scope of tickets to use for the report.
How the report is calculated
- Issues created measure is the total number of created issues that match the selected scope of tickets (JQL). The measure is grouped by issue creation date on Time dimension.
- Issues resolved are the issues that have resolution and resolution date. The measure is grouped by issue resolution date on Time dimension.
Basics of the report
The “Created vs Resolved” report uses basic HTML, JavaScript and Chart.js charting library. It is available in the integrated app gallery of the latest version.
Test Report Builder 30 days for free and discover your possibilities. Already available on the Marketplace.
Was this helpful?
Thanks!
Andrei Pisklenov _Actonic_
0 comments