Missed Team ’24? Catch up on announcements here.
×Community resources
Community resources
Community resources


How do I build a dashboard that tracks the number of days child issues have been in progress?
My team is wanting to build a dashboard that tracks how long the issues under a specific Epic have been in progress. In progress is defined as the total number of days it takes to move an issue from "In-progress" to "Awaiting Acceptance". The idea is that for each release we could see how much of our time we are spending on each of the epics that we are trying to progress. We would calculate our time by summing the number of days it takes to move each issue in the epic from "in-progress" to "Awaiting Acceptance".
For example....if we are working on four epics, all of which are at different points in their maturity we should see different amounts of time being spent on each epic. Epics where we are performing early exploration/spikes should have a smaller number of tickets and therefore less person-days while those that are in full blown development should be occupying the majority of our time with many tickets being completed each release. If we have a dashboard for each release we should be able to see the number of person days being invested in each epic.
I played around with some of the dashboard gadgets but I did not see anything that allowed you to select the specific transitions that you want to track.
5 answers
You can achieve it with Time in Status. To get dashboard that tracks how long the issues under a specific Epic have been in progress just simply
- Install add-on
- Create dashboard by Time in Status
- Filter issues by JQL
parentEpic in (x)
replace X with your epic name
and you will get summed time for all issues under the Epic. If you need to create dashboard for each issue under the epic, you can create dashboard for each issue using JQL as well.
For precise calculations, you can select your preferred work calendar and format.

Here we are!

You can also book a live demo - we'll show you the application inside out and answer all your questions.
Add-on has a 30-day free trial version, free up to 10 users and developed by my team SaaSJet.
Hope it helps 😌

You can use Jira Rest API's to pull this data. Or as an alternate if your fine to try out mktplace app, take a look at
I believe the time between status transitions report in the app will suffice the requirements. The app has many other reports to help track your projects.
The app is free for 10 users. Do try it out.
Disclaimer : I work for RVS, the vendor for this app

You must be a registered user to add a comment. If you've already registered, sign in. Otherwise, register and sign in.
Hello @Eric Douglas Anderson ,
There is no built in solution in Jira for this. So in order to track the time spent on each status I suggest you use a marketplace app. Time in Status the oldest and leading Time in Status app in Atlassian Marketplace, which is developed by my team at OBSS, has a report type that will meet your need. Our app is available for both Jira Cloud, and Data Center.
Time in Status mainly allows you to see how much time each issue spent on each status or each assignee.
Status Duration report (please see the screenshot above) which shows how much time each issue spent on each status. You can combine the time for multiple statuses to get metrics like Issue Age, Cycle Time, Lead Time, Resolution Time etc.

For all numeric report types, you can calculate averages and sums of those durations grouped by the issue fields you select. For example total in-progress time per customer or average resolution time per sprint, week, month, issuetype, request type, etc. The ability to group by parts of dates (year, month, week, day, hour) or sprints is particularly useful here since it allows you to compare different time periods or see the trend.

The app calculates its reports using already existing Jira issue histories so when you install the app, you don't need to add anything to your issue workflows and you can get reports on your past issues as well.
Time in Status reports can be accessed through its own reporting page, dashboard gadgets, and issue view screen tabs. All these options can provide both calculated data tables and charts. And the app has a REST API so you can get the reports from Jira UI or via REST. Also you can export the reports in to various formats easily.
Visit Time in Status to explore how our JIRA add-on can revolutionize your metrics measurement process. Enjoy a 30-day free trial to experience the full range of features.
If you wish, you can also schedule a live demo. We will provide a comprehensive overview of the application and address any inquiries you may have.
Hope it helps,
Gizem
You must be a registered user to add a comment. If you've already registered, sign in. Otherwise, register and sign in.
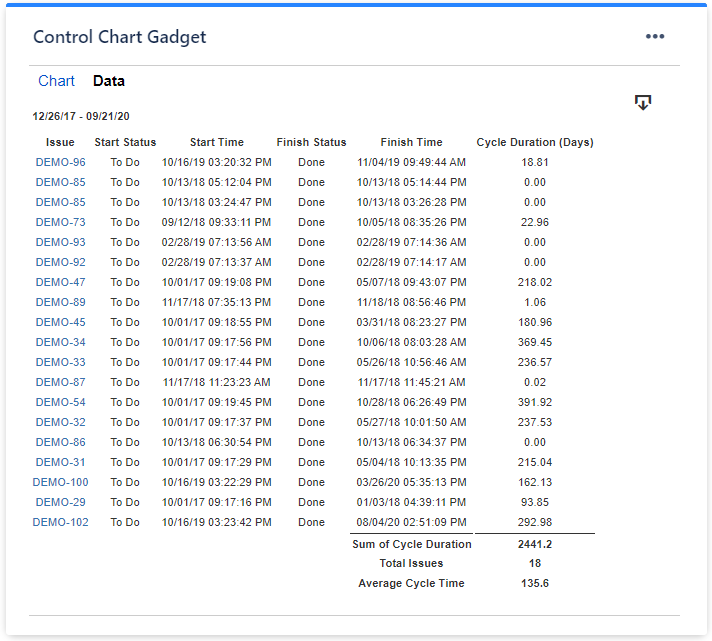
What you actually need is a cycle time gadget, to measure the cycle duration from "In-progress" to "Acceptance', in days.
Our Great Gadgets app offers all you need for tracking this via a dashboard. They work based on a filter/JQL, let's you select specific transitions and can display the time in days.
Here is the complete solution for you:
Control Chart - displays the issues by their cycle in a plot chart. It displays the average and let's you set a threshold to identity the ones that took longer than expected (the ones in red)

Cycle Time Trend - let you measure the cycle time for past time intervals and displays the trend

Histogram Chart - displays the cycle time distribution and total number of issues that took longer than expected

These gadgets offer also a Data tab with the list of issues and their cycle time, which can be exported in CSV.
See also this article: https://community.atlassian.com/t5/Jira-Software-articles/Building-a-powerful-Kanban-dashboard-in-Jira-with-Great-Gadgets/ba-p/1664331
Hope this helps.
Danut.
You must be a registered user to add a comment. If you've already registered, sign in. Otherwise, register and sign in.
Jira doesn't have a built-in solution for the report you mentioned. If you prefer using a marketplace app, you can try Status Time Reports app developed by our team. It mainly provides reports and gadgets based on how much time passed in each status. You can group issues by Parent(aka Epic) and have a report similar to the below.

For further details, you can have a look at Status Time Reports How to Videos.
If you are looking for a completely free solution, you can try the limited version Status Time Reports Free.
If you need any help, feel free to contact us via support@bloompeak.io or schedule a demo with us.
Hope it helps.
You must be a registered user to add a comment. If you've already registered, sign in. Otherwise, register and sign in.

Was this helpful?
Thanks!
DEPLOYMENT TYPE
CLOUDPRODUCT PLAN
PREMIUMTAGS
Community showcase
Atlassian Community Events
- FAQ
- Community Guidelines
- About
- Privacy policy
- Notice at Collection
- Terms of use
- © 2024 Atlassian
You must be a registered user to add a comment. If you've already registered, sign in. Otherwise, register and sign in.