Community resources
Community resources
Community resources
workflow transition by month
I need a historical table to show monthly wise how many tickets were in each workflow status. like I have a status "in progress" so how many issues that are in this status every month.
table format:
status = row
month = column
2 answers
1 accepted
Hi @Mariam Mohamed,
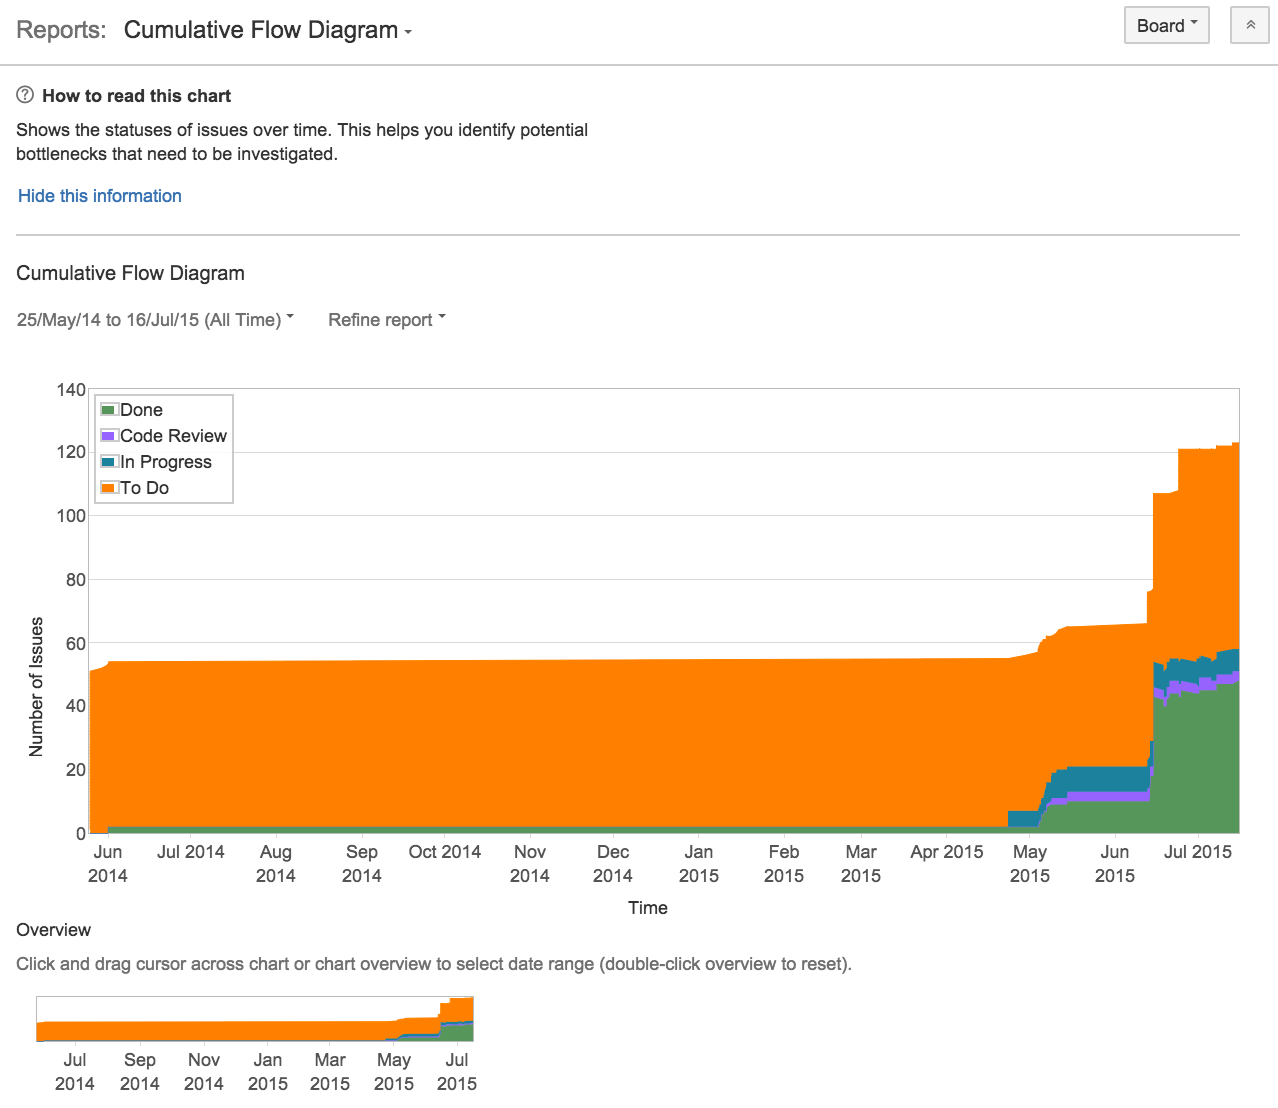
Without the need to invest in reporting apps and using out of the box functionality, you may want to take a look at the Cumulative Flow Diagram that pretty much presents this information. It is a default report included in all your agile boards.
Hope this helps!
Hi Walter,
Thanks for the swift response, do you know how can I have this chart in table format?
You must be a registered user to add a comment. If you've already registered, sign in. Otherwise, register and sign in.
It is only available as a chart. To build something yourself, I would recommend looking at BI tools that can pull in your Jira data and create trends reports from them. Jira's built in reporting is quite decent to display real time data, but doesn't over much to display historical evolution.
If you happen to have a BI tool available (like e.g. PoweBI or Tableau, ...) you can look at connector apps to bring your data into that tool easy. Or if you want to bring a reporting solution into your Jira instance, EazyBI is a very good option as well.
You must be a registered user to add a comment. If you've already registered, sign in. Otherwise, register and sign in.
yes I have eazybi tool and I found the cumulative flow diagram in the sample reports, I will do modifications on the report and hopefully this is the solution we are looking for, thanks again!
You must be a registered user to add a comment. If you've already registered, sign in. Otherwise, register and sign in.

Thanks for posting your question!
You may want to check out this History report - https://eazybi.com/accounts/1000/cubes/Issues/reports/50046-unresolved-issues-by-statuses-over-time
You can switch to the table chart, if needed, and also adjust the filters according to your use case!
Best wishes,
Elita from support@eazybi.com
You must be a registered user to add a comment. If you've already registered, sign in. Otherwise, register and sign in.
Thank you @elita_kalane do you know what is the difference between these two measures:
- issues history
- transition to status
both measures are giving different results and I'm not sure how each measure count the issues under workflow status for every month.
You must be a registered user to add a comment. If you've already registered, sign in. Otherwise, register and sign in.
Thanks for the follow-up!
Indeed, these two measures are quite different.
In this context, measure Issue history counts how many issues are in each status at the end of each time period.
Transitions to Status - How many times during selected Time dimension period issue has been transitioned to the status that is selected in Transition Status dimension
To visualize:
I have this one issue key ETQ-259 which shows value 1 against "Issues history" Transition Status "In Progress" and it shows value 2 against measure "Transitions to Status"
Against Issues history it shows 1, because in the Selected Time period (end of this period), it finds that there is 1 issue in the particular Status.

However, against measure "Transitions to Status" it shows 2, because in October this issue transitioned to the Status "In Progress" 2 times
.png")
I hope this clarifies your question!
Best wishes,
Elita from support@eazybi.com
You must be a registered user to add a comment. If you've already registered, sign in. Otherwise, register and sign in.
Great! Thank you very much for the detailed explanation about the measures @elita_kalane , I believe the measure: transition to status is what I'm looking for as I want to know how many tickets moved to certain status each month.
I have one more question regarding this point:
However, against measure "Transitions to Status" it shows 2, because in October this issue transitioned to the Status "In Progress" 2 times
is there a way where I can remove the duplicates or highlight the duplicated transitions?
You must be a registered user to add a comment. If you've already registered, sign in. Otherwise, register and sign in.
Hi @Mariam Mohamed ,
In that case, you can use the measure "Transitions to Status issues count" which will return the distinct count of issues. You can learn more about the historical measures here - https://docs.eazybi.com/eazybi/data-import/data-from-jira/import-issue-change-history#Importissuechangehistory-Measures
See the screenshot below with the same example and the additional measure "Transitions to Status issues count"
.png")
Best wishes,
Elita from support@eazybi.com
You must be a registered user to add a comment. If you've already registered, sign in. Otherwise, register and sign in.
You must be a registered user to add a comment. If you've already registered, sign in. Otherwise, register and sign in.
Hi @Mariam Mohamed,
As mentioned already, the Cumulative Flow Diagram report of Jira could be a good solution, although it is not so flexible in term of input data - it is at the project level and does not allow custom JQL/filtering.
If you consider the idea of using a plugin, then our Great Gadgets app offers a Cumulative Flow Diagram gadget that is highly configurable and easy to use. Allows CFD by issue status, status category, board column, etc

Danut
You must be a registered user to add a comment. If you've already registered, sign in. Otherwise, register and sign in.

You must be a registered user to add a comment. If you've already registered, sign in. Otherwise, register and sign in.