Community resources
Community resources
Community resources
is it possible to get a ticket's timeline as a breakdown on the chart or table?

Here in example below, there is 1,5month between two responsible's action.
I need a chart to track the time difference between the actions taken by 2 supervisors to reduce this long period. Is Jira able to create it in this specific manner?
thanks in advance.
meral.cetintas@daimlertruck.com
5 answers
welcome to the community!
As you've surely noticed by now, this is an area in which a number of Marketplace apps operate. If you're open to solutions from the Marketplace, I think you'd like the app that my team and I are working on, JXL for Jira.
JXL is a full-fledged spreadsheet/table view for your issues that allows viewing, inline-editing, sorting, and filtering by all your issue fields, much like you’d do in e.g. Excel or Google Sheets. It also comes with a number of so-called history columns that aren’t natively available, including time in [status], time between [status] and [status], and many more.
This is how it looks in action:
As you can see above, you can easily sort and filter by your history columns, and also use them across JXL's advanced features, such as support for (configurable) issue hierarchies, issue grouping by any issue field(s), sum-ups, or conditional formatting.
Any questions just let me know,
Best,
Hannes
Merhabalar @meral cetintas 👋
Atlassian Community'e hoşgeldiniz!
I believe that Time in Status will help you with your issue. We have a lot of features to help you, so I recommend you book a live demo for add-on. We'll show you the application inside out and answer all your questions.
So, you can find bottlenecks in a table view report with Smart view feature.
Chart view is also available.
Also, you can display the time spent in a particular status in a custom field to reduce long periods of staying at one status.
For more in-depth data analysis, you can create reports as pivots. For example, you can look at the percentage of time spent in different statuses.
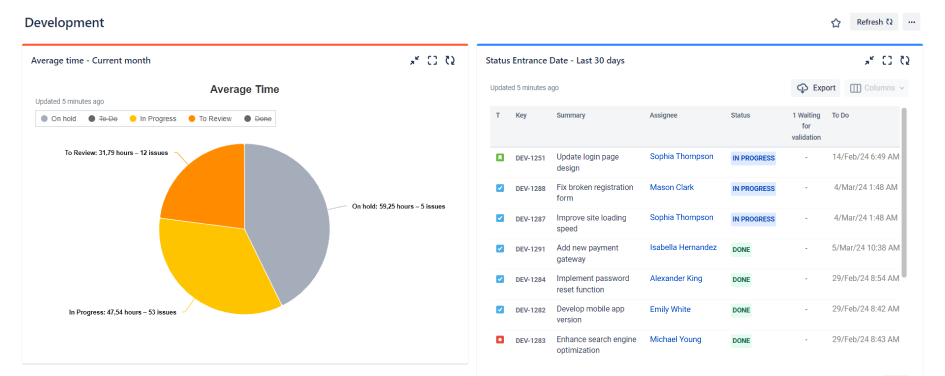
Dashboards gadgets feature will keep your finger on the pulse and track team productivity in real-time.
For Scrum teams we are also offering Sprint Report feature in Time in Status
Add-on have 30-day free trial, free up to the 10 users and developed by my team.
I hope you find this helpful 🚀
You must be a registered user to add a comment. If you've already registered, sign in. Otherwise, register and sign in.
Merhaba @meral cetintas ,
To get a report of time spent on each status, I can recommend Status Time Reports app developed by our team. It mainly provides reports and gadgets based on how much time passed in each status.
Here is the online demo link, you can see it in action and try without installing the app.
For example, if you want to get a report of how much time passed on each status of an issue, you can have a look at Time in Status for Each Issue report. This app has a dynamic status grouping feature so that you can generate various valuable reports as time in status, time in assignee, status entry dates and status counts, cycle time and lead time, resolution time, average/sum reports by any field(e.g. average in progress time by project, average cycle time by issue creation month).
For further details, you can have a look at Status Time Reports How to Videos.
App Fetures:
- You can search issues by Project, Issue Type, Status, Assignee, Issue Creation/Resolution Date(and any other Date field) and JQL Query.
- Status durations are calculated according to the working calendar you define. Once you enter your working calendar into the app, it takes your working schedule into account too. That is, "In Progress" time of an issue opened on Friday at 5 PM and closed on Monday at 9 AM, will be a few hours rather than 3 days.
- You can set different duration formats.
- You can export reports in CSV file format and open them in MS Excel.
- You can also add this app as a gadget to your Jira dashboards and reach “Status Time” from Issue Detail page.
- You can enable/disable access to Status Time reports&gadgets and Issue Detail page per project, users, groups or project role.
If you are looking for a completely free solution, you can try the limited version Status Time Reports Free.
If you have any questions, feel free to schedule a demo with us.
Hope it helps.
You must be a registered user to add a comment. If you've already registered, sign in. Otherwise, register and sign in.
Meral Hanım Merhabalar @meral cetintas
Atlassian Community'e hoşgeldiniz!
Talep etmiş olduğunuz raporlara OBSS tarafından geliştirilen Timepiece isimli Jira eklentimiz ile kolaylıkla ulaşabilirsiniz. Aynı soruya cevap arayan diğer kullanıcıların da anlayabilmeleri için açıklamaya İngilizce olarak devam edeceğim. Konuyla ilgili detaylı bilgi veya görüşme isterseniz online demo linki üzerinden size uygun bir vakitte toplantı ayarlayabilirsiniz.
In order to measure total time spent by each agent on a ticket I suggest you use a 3rd party app. For this purpose I can recommend Timepiece (formerly Time in Status) app, the oldest and leading Time in Status app in Atlassian Marketplace, which is built by my team at OBSS. It is available for both Jira Cloud, and Data Center.
Timepiece mainly allows you to see how much time each issue spent on each status and on each assignee.
Timepiece offers two report types for your case:
Assignee Duration or Assignee Duration per Status reports which shows how much time each assignee spent on each Status. These reports show a list of issues by default so you can see the metric values for each issue separately. Please refer to the screenshots below.


The app calculates its reports using already existing Jira issue histories so when you install the app, you don't need to add anything to your issue workflows and you can get reports on your past issues as well.
Timepiece reports can be accessed through its own reporting page, dashboard gadgets, and issue view screen tabs. All these options can provide both calculated data tables and charts. And the app has a REST API so you can get the reports from Jira UI or via REST. Also you can export the reports in to various formats easily.
Visit Timepiece (formerly Time in Status) to explore how our JIRA add-on can revolutionize your metrics measurement process. Enjoy a 30-day free trial to experience the full range of features.
If you wish, you can also schedule a live demo. We will provide a comprehensive overview of the application and address any inquiries you may have.
Hope it helps,
Gizem
You must be a registered user to add a comment. If you've already registered, sign in. Otherwise, register and sign in.
Hi @meral cetintas,
An easy way to measure and track this is to use the gadgets offered by our Great Gadgets app.
In this case, I would recommend the Cycle Time Control Chart gadget.
This gadget let's you measure the time between two workflow statuses (cycle time) and displays the issues in a plot-diagram by their cycle time duration.
In your example, you need to configure the gadget with a filter that returns the issues from your project and configure to measure the cycle time as the time between entrance in status Order Created and the entrance in status ATS ORDER CONFIRMED. As a result, you will get something like this.
Each issue (dot) is represented on oX axis by the time when it entered ATS ORDER CONFIRMED status and on oY by the cycle duration, in days.
The gadget allows you to set a threshold, so you can easily identify the ones that took longer (the ones in red color).
Hovering a dot in the chart will give you details about the issue.
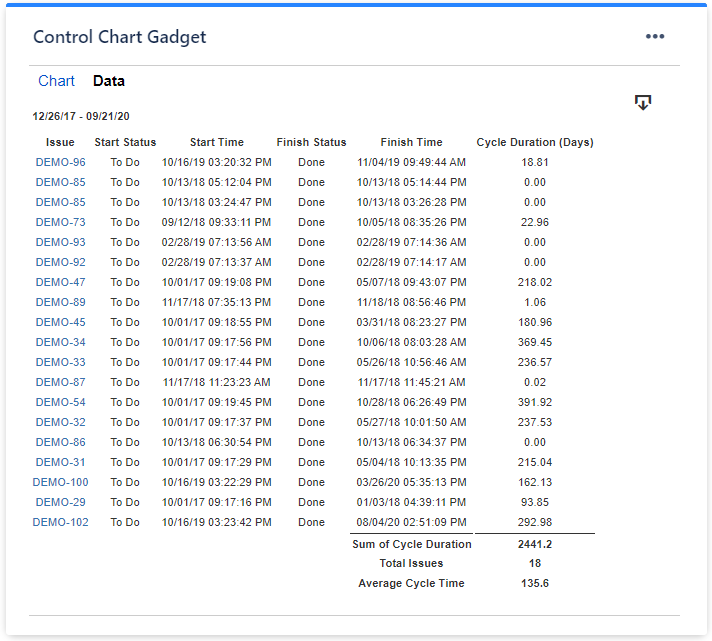
The gadget can display a data tab with a detailed report that you can easily export in CSV, like in this example:

You can also use Cycle Time Trend gadget or Histogram gadget offered by the same app.
Find more about these gadget here: https://community.atlassian.com/t5/Jira-articles/Building-a-powerful-Kanban-dashboard-in-Jira-with-Great-Gadgets/ba-p/1664331
You could start with 1-month of free trial. If you need any help, please contact us at support@stonikbyte.com.
Hope this helps.
Danut.
You must be a registered user to add a comment. If you've already registered, sign in. Otherwise, register and sign in.

Was this helpful?
Thanks!
TAGS
Community showcase
Atlassian Community Events
- FAQ
- Community Guidelines
- About
- Privacy policy
- Notice at Collection
- Terms of use
- © 2025 Atlassian


You must be a registered user to add a comment. If you've already registered, sign in. Otherwise, register and sign in.