Community resources
Community resources
Community resources
What SLA does Jira use for metrics if there are multiple
I have one project with 3 different regions, US, UK, APAC submitting request. We have a US time to resolution and time to first response SLA and recently added a time to resolution SLA for APAC. We're in process of adding similar TTR and TTFR for UK as well as TTFR for APAC.
How does Jira know which SLA to use when calculating metrics, reports, graphs etc for the respective measure, either TTR or TTFR?
2 answers
Hello @Robert Ortega ,
First, the region has to be represented on your issues in some way. For example, you can create a Select List field named "Region", put all possible region names as options for this field, add this field to your tickets, and make sure all tickets have a value for this field.
After that, you can set multiple goals for your SLA metrics. For example, you create a Response Time metric and set goals like below:
If Region=A then Goal = 4 hr
If Region=B then Goal = 8 hr
If Region=C then Goal = No Goal
Hope this helps.
EmreT
Thank you, region was built in from the start but they didn't think about tracking metrics. I will look this.
You must be a registered user to add a comment. If you've already registered, sign in. Otherwise, register and sign in.
Hi @Robert Ortega ,
Try also our Great Gadgets app. It offers many gadgets that allows you to track the SLA.
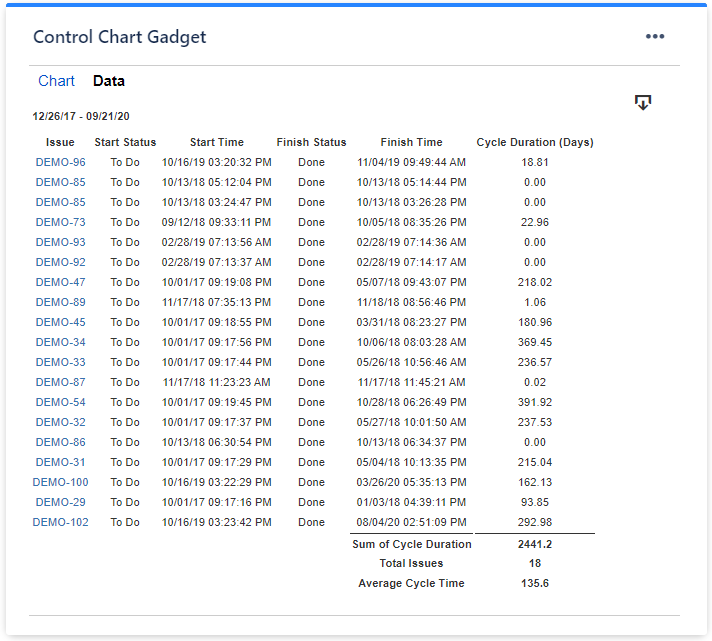
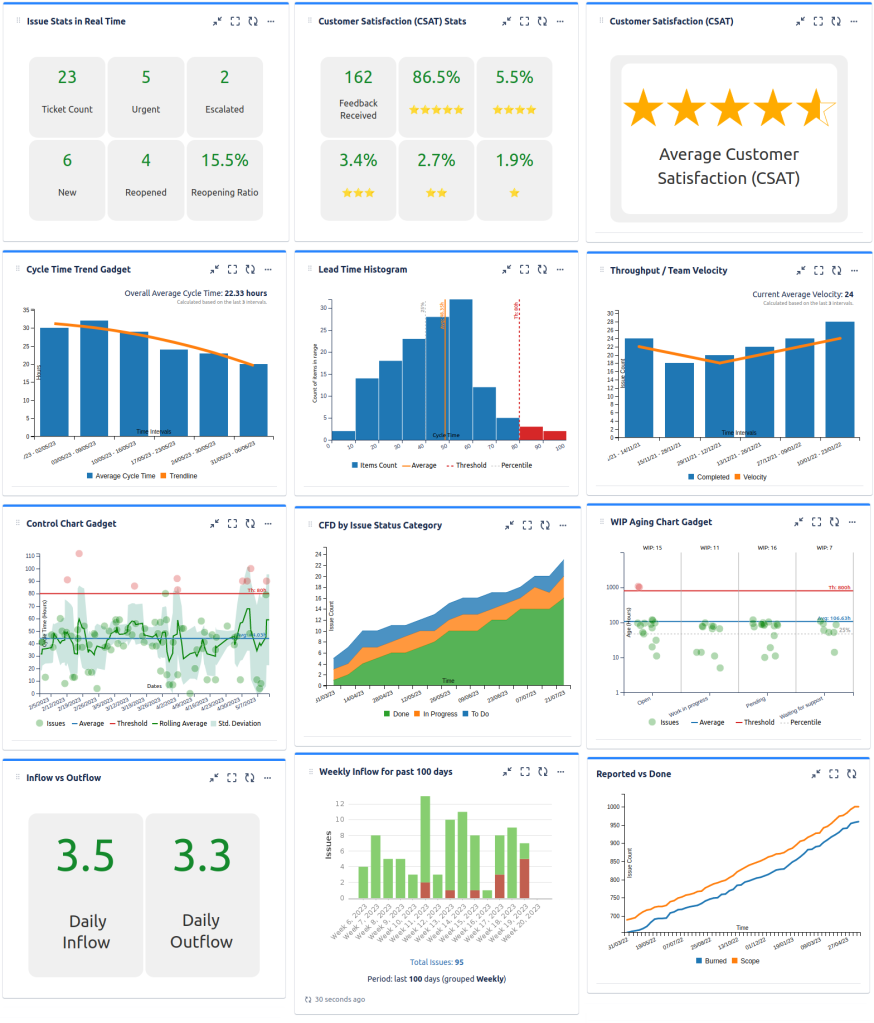
For example, by using the Control Chart gadget, which uses a Jira filter as data source, you can track the global SLA as well as the SLA for each region. You decide what to measure.
The gadget will calculate and display the average SLA for that region and you can set a maxim Threshold. Once you set the threshold, the issues that breached the SLA will appear in chart in red-color.

Also, you can track SLA as a Trend Chart - to see if the team response improves over time

Or as a Histogram Chart - showing the number of issues in each SLA range

These gadget offers also a Data tab with nice report showing the SLA for each issue as well as the average SLA.
This app offers many other gadgets for tracking projects in Jira Service Management. You could build tracking dashboard for each region or at the global level.
 See this article from our blog for how to do it: An effective dashboard for Service Desk and Customer Support teams in Jira Service Management.
If you need help, please contact us at support@stonikbyte.com.
Danut.
You must be a registered user to add a comment. If you've already registered, sign in. Otherwise, register and sign in.

You must be a registered user to add a comment. If you've already registered, sign in. Otherwise, register and sign in.