Community resources
Community resources
Community resources
Velocity Chart
Hello,
In my sprints, I follow the following procedure:
1. during sprint planning, i assign original estimates to a US and update the same value for the field SP.
2. As the sprint progresses, my team keep reducing the SP based on how much work is left to do in the sprint. So basically the field SP is the To-Do estimate. So for a completed story, the SP is set to '0'. This gives me a burn down chart with SP on Y-Axis and dates on X-axis.
The problem comes when i publish the velocity chart at the end of the sprint. since all the completed stories have '0' SP value, in other words, to-do effort is '0', the Velocity chart shows 0 as SP completed.
is there a way to customize this behaviour. Or if you could give me an alternate Way of working, it would be very helpful.
Thanks
2 answers
Hi @Nilay Sinha,
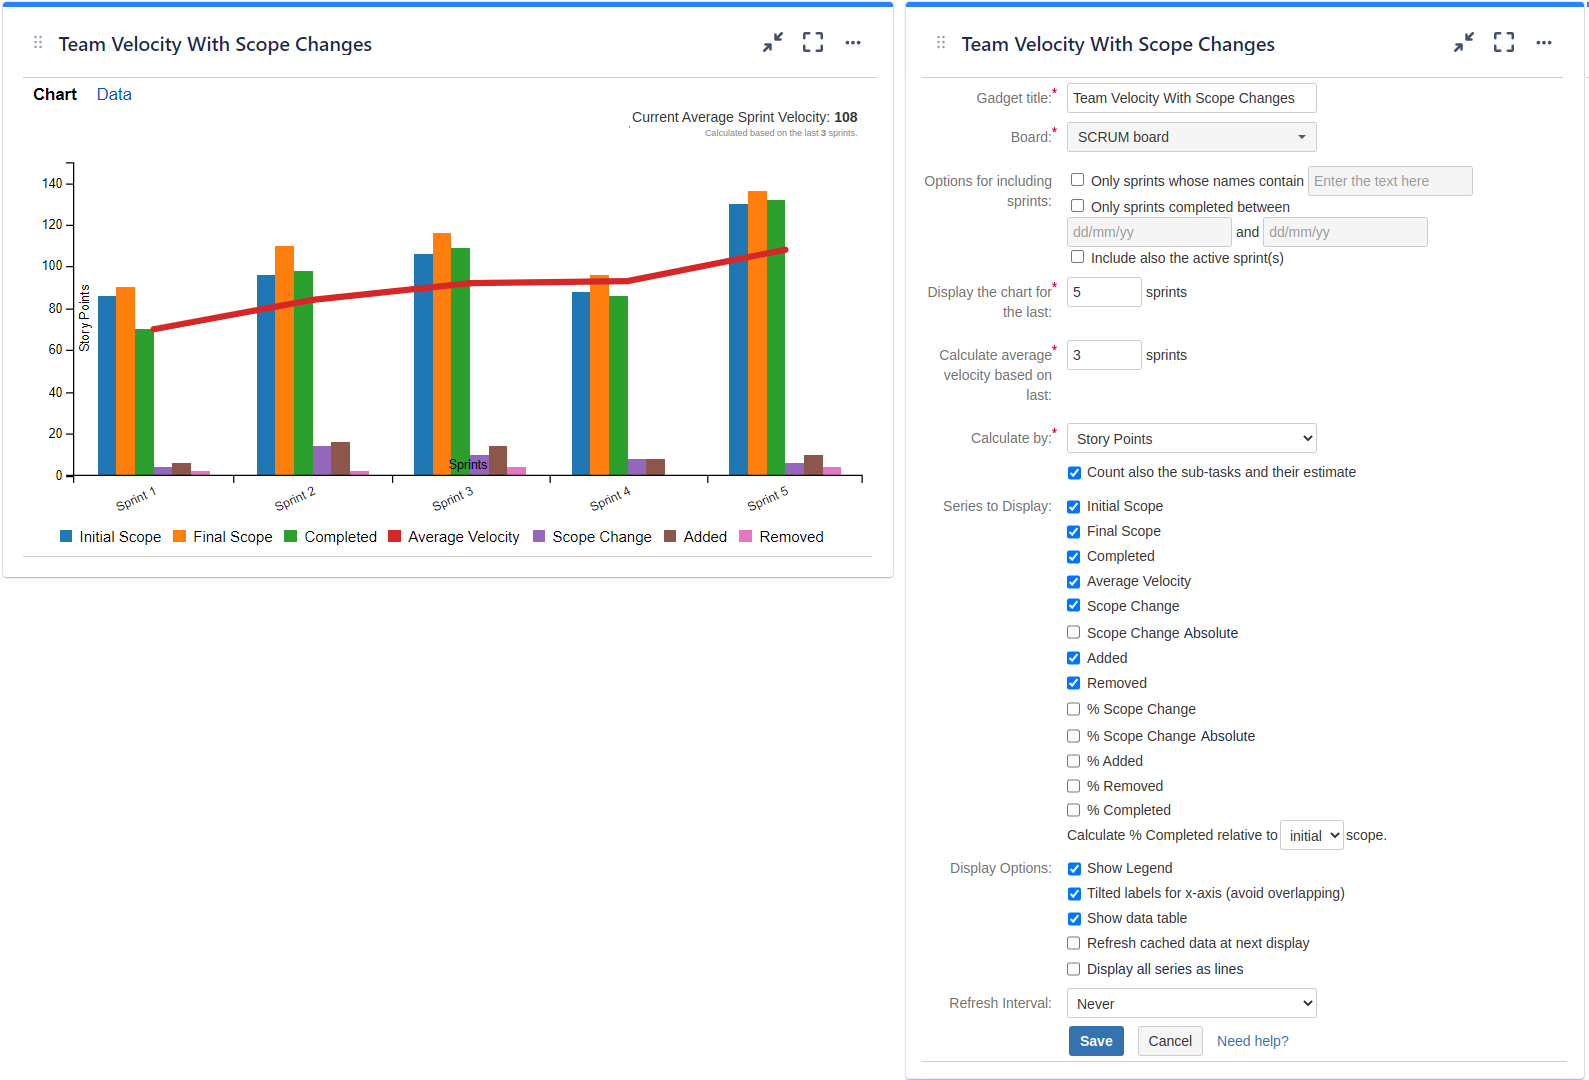
Try our Great Gadgets app. It includes a Team Velocity chart that allows you to display the chart by "Initial Scope" and it works also based on a custom field (in case you use custom fields for tracking).
Danut.

Hi @Nilay Sinha ,
You are correct, the velocity chart will show "0" at the end of the sprint because there are no story points left in the completed sprint; they've all been removed. I Jira this means that all of the work done in the sprint amounts to 0 points.
Instead of setting the story points to 0 when the story is completed, the team should be moving the story to "Done" status and leaving the points alone. This will allow you to use the sprint burndown report over the course of the sprint to gauge the work remaining and the velocity report at the end of the sprint to show the team's current amount of work that can be completed in a sprint.
To keep your current burndown process with SP on Y-Axis and dates on X-axis I suggest using a custom field named "Remaining Story Points" and adjusting your report to pull that value.
Hope this helps,
-Scott
You must be a registered user to add a comment. If you've already registered, sign in. Otherwise, register and sign in.
Hello @Scott Theus
Thanks a lot for your response.
A follow up query: If I update the Y-axis to reflect a new custom field "Remaining Story point", will the same burndown chart reflect in my dashboard gadget?
Thanks in advance.
You must be a registered user to add a comment. If you've already registered, sign in. Otherwise, register and sign in.
The gadget is based on the "estimation basis" you have set up in the board. Once you add the Remaining Story Points field you will want to also create a board to use that field for estimates.
Here is some documentation on how to change the estimation basis to a custom field:
https://confluence.atlassian.com/adminjiracloud/configuring-a-custom-field-776636423.html
-Scott
You must be a registered user to add a comment. If you've already registered, sign in. Otherwise, register and sign in.
You must be a registered user to add a comment. If you've already registered, sign in. Otherwise, register and sign in.
@Scott Theus I took your advice and had a new field added to my jira issues called "remaining story points" to track the to do effort of each US. that way i kept the field Story point constant as the original estimate. At the end of sprint when i checked the velocity chart now the y axis displays "Remaining story points" instead of "Story points".
This beats the whole purpose of adding the new field.
You must be a registered user to add a comment. If you've already registered, sign in. Otherwise, register and sign in.

You must be a registered user to add a comment. If you've already registered, sign in. Otherwise, register and sign in.