Community resources
Community resources
Community resources
Time to first response

I imported data from Jira to power bi using Power bi connector but there is no column with the name “Time to first response”. I need it to create report. Maybe it is there but with different name? Please give me advice
1 answer
Try our Great Gadgets app. It offers some gadgets that allow you to track the time between two workflow statuses (cycle time, lead time, time to first response, etc), configurable at your choice.
You can configure them to measure the time between "issue creation" and the first entrance in "Waiting customer" status, for example, which is actually "Time To First Response" (TTFR).
More specifically, you have various ways to visualize TTFR.
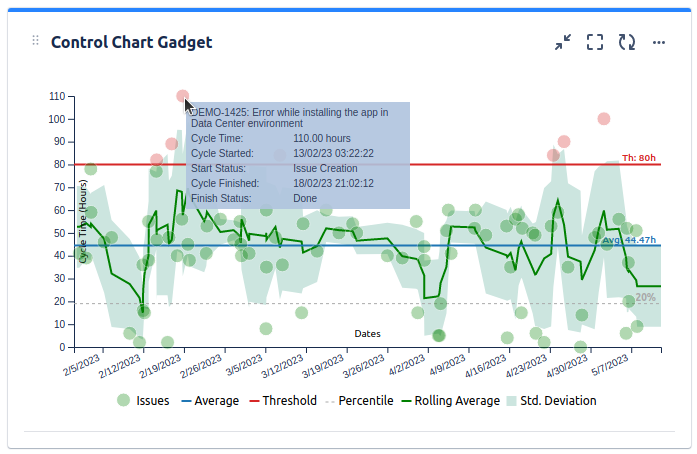
Control Chart - this displays the issue by their TTTFR. You have the option to set a threshold, so that the chart can highlight the issues that breached the TTFR limit.
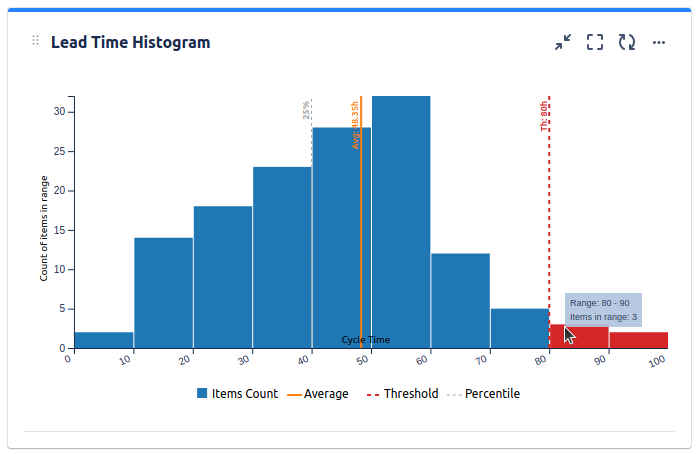
Histogram Chart - display the issues by their TTFR, showing how many were in each range and how many breached the TTFR limit.
 Trend Chart - to see if the TTFR response over time and the trend (if the team improves in time or not)

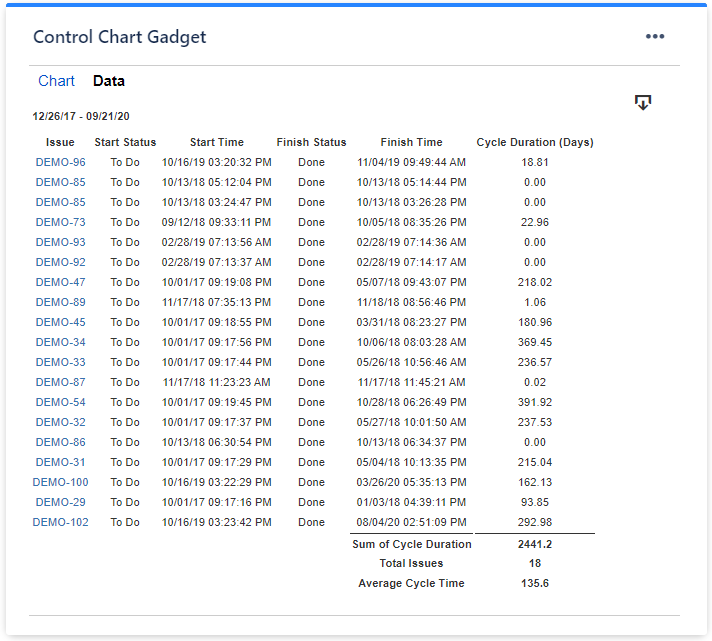
These gadget offers also a Data tab with nice report showing the TTFR for each issue as well as the average TTFR.
This app offers many other gadgets for tracking projects. See also this article from our blog to make a better idea: An effective dashboard for Service Desk and Customer Support teams in Jira Service Management.
I hope this helps. If you need help, please contact us at support@stonikbyte.com.
Danut

You must be a registered user to add a comment. If you've already registered, sign in. Otherwise, register and sign in.