Community resources
Community resources
Community resources
The apply of Control Chart

I don't know how to use the Control Chart at all,who can explan it and give a detail example?Thank you very much!
2 answers
Hi @Frankyzhou and welcome to the Community!
The control chart gives you insight in the lead and cycle times of the issues on your board. Have a look at this support article to learn more.
Hope this helps!

Hi @Frankyzhou -- Welcome to the Atlassian Community!
Yes, and...to Walter's answer, here are some potential things to watch for Atlassian's interpretation of a control chart based on my process analysis experience:
- When multiple items have the same measure, they get rolled up into one value (large dots for a cluster of issues) and so do not show the flow details. The work-around is to use filters or adjust the time scale to separate them over the x-axis.
- When the range of values on the y-axis (Elapsed Time) is too great, the scale unfortunately changes to Atlassian's interpretation of "cube-root power scale", making interpreting the chart much more difficult and less valuable. The work-around is to use filters or adjust the time scale to reduce the number of items...although this does not always help.
- The y-axis (Elapsed Time) is in Days, and experimentation shows a "day" = 24h for this chart, regardless of your site settings. This means the pattern/shape of the chart may be helpful for process analysis, but if you need hour-granularity for cycle time consider investigating other tools from the marketplace or by exporting the issue histories and building your own charts.
- The interpretation of Predictability as "standard deviation" (the blue shaded area) is at best confusing except for a very, under control process flow, apparently due to the method of changing the time interval frequently. If you need better measures of variability investigate other tools in the marketplace or calculate the values with your own data.
Kind regards,
Bill
You must be a registered user to add a comment. If you've already registered, sign in. Otherwise, register and sign in.
First,thank you for your answer!
Can you give me some charts to illustrate the normal and abnormal conditions?
You must be a registered user to add a comment. If you've already registered, sign in. Otherwise, register and sign in.
Hi @Frankyzhou
The documentation page Walter provided for the control chart shows examples of these symptoms, with the first chart showing issue clusters, the 24h day, and variation in predictability. The second chart showing the change in the y-axis.
These are how this Atlassian chart works, so there is no normal or abnormal; they just impact a team's ability to use the information for seeing process improvement opportunities. To see other ways of presenting such information, please take a look at the Atlassian Marketplace to see other vendors' tools and books/sources on creating control charts from process data.
You must be a registered user to add a comment. If you've already registered, sign in. Otherwise, register and sign in.
Hi @Frankyzhou,
As an alternative to the Control Chart from Jira, you could try the Control Chart gadget offered by our Great Gadgets app. It is similar to the one from the Jira reports, but much more configurable and flexible.
With this gadget you can visualize the issues resolved in a certain time-period (let’s say, last 4 weeks) in a plot-chart, based on their cycle time, lead time or time between any two specific statuses from your workflow.
It also allows you to set a threshold (representing your SLA agreed with the customers, for example) for easily identifying the issues that took longer than expected. The average displayed by the chart indicates your current average SLA / Resolution Time.
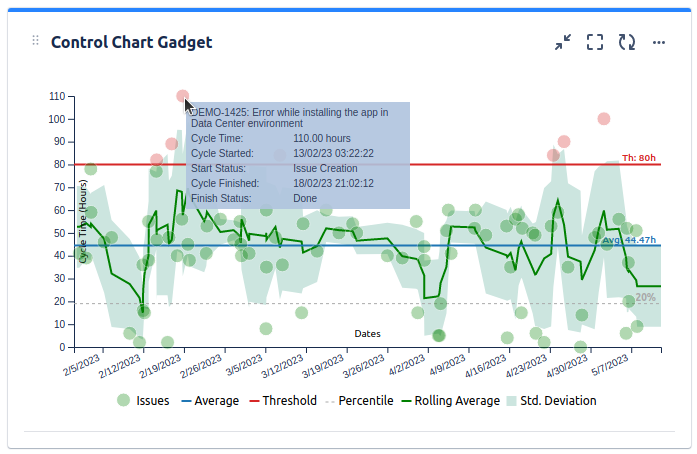
Simply hovering the issues in the chart, will give you insightful details about it, like issue summary and its cycle duration, so you can intervene and investigate further.
The app offers many other gadgets that you might find useful.
If you have questions, please feel free to contact us at support@stonikbyte.com.
Danut.
You must be a registered user to add a comment. If you've already registered, sign in. Otherwise, register and sign in.

You must be a registered user to add a comment. If you've already registered, sign in. Otherwise, register and sign in.