Community resources
Community resources
Community resources
How to calculate time spent on each status and total time on the issue
How to calculate time spent on each status like 'Dev in Progress' & 'in QA' and total time on the issue
6 answers
Hi @Jahnavi Pathak 👋
As an alternative , I guess you can try Time in Status (developed by my team). Add-on allows you to calculate time spent on each status, total time. Also you will have 7 reports and Sprint performance report for planing.

Add-on has a 30-day free trial version and free up to 10 users.
Hope it helps 😌
as already suggested, there are a number of apps available on the Atlassian Marketplace that can help with this. When searching the Marketplace, I would recommend checking an app's reviews, and looking out for Atlassian certifications like e.g. Cloud Fortified. You may already know that you can trial any app for free for 1 month, and depending on the app and the site of your Jira site, it may be free forever - so if an app is an option for you, perhaps try out a few and see which one works best for you.
To provide a concrete app recommendation: Your use case would be easy to solve using the app that my team and I are working on, JXL for Jira.
JXL is a full-fledged spreadsheet/table view for your issues that allows viewing, inline-editing, sorting, and filtering by all your issue fields, much like you’d do in e.g. Excel or Google Sheets. It also comes with a number of so-called history columns that aren’t natively available, including time in status, time between statuses, and time between created and resolved. This is how it looks in action:

As you can see above, you can easily sort and filter by your history columns, and also use them across JXL's advanced features, such as support for (configurable) issue hierarchies, issue grouping by any issue field(s), sum-ups, or conditional formatting.
Any questions just let me know,
Best,
Hannes
You must be a registered user to add a comment. If you've already registered, sign in. Otherwise, register and sign in.

The built-in control chart can do this, as described here: https://support.atlassian.com/jira-software-cloud/docs/view-and-understand-the-control-chart/
The chart has some challenges, such as when lots of issues show in clusters and when a large cycle time range impacts the y-axis display. If this one does not meet your needs please investigate the Atlassian Marketplace for addon reporting and dashboard gadgets.
Kind regards,
Bill
You must be a registered user to add a comment. If you've already registered, sign in. Otherwise, register and sign in.
Hi @Jahnavi Pathak ,
Not sure if there is out of the box solution for the Jira UI
There are 2 ways that you can try it out:
- Export the issues to Excel and using the Excel in Jira plugin you can select the Status related options
- https://marketplace.atlassian.com/apps/1222051/status-time-reports-free-time-in-status?tab=overview&hosting=cloud : this is a free plugin that I personally use to achieve this use case, it's the simplest way to achieve the required output.
You must be a registered user to add a comment. If you've already registered, sign in. Otherwise, register and sign in.
Hello @Jahnavi Pathak
I can recommend Timepiece - Time in Status for Jira which is built by my team at OBSS. It is available for Jira Server, Cloud, and Data Center.
Time in Status mainly allows you to see how much time each issue spent on each status.

Time in Status offers two report types for your case:
The first one is Status Duration report (please see the screenshot above) which shows how much time each issue spent on each status. You can combine status times to see measurements like Issue Age, Cycle Time, Lead Time, Resolution Time etc.
As an alternative approach, Time in Status also has Duration Between Statuses report type which shows the duration between two specific statuses. This report type also allows the user to exclude the times for "pause" statuses.


These reports show a list of issues by default so you can see the metric values for each issue separately. Also, for all numeric report types, you can calculate averages and sums of those durations grouped by the issue fields you select. For example total cycle time per customer (organization) or average resolution time per sprint, week, month, issuetype, request type, etc. The ability to group by parts of dates (year, month, week, day, hour) or sprints is particularly useful here since it allows you to compare different time periods or see the trend.
All these report types, including averages and sums, can be turned into charts.
Time in Status calculates its reports using already existing Jira issue histories so when you install the app, you don't need to add anything to your issue workflows and you can get reports on your past issues as well. It supports both Company Managed and Team Managed projects.
Time in Status reports can be accessed through its own reporting page, dashboard gadgets, and issue view screen tabs. All these options can provide both calculated data tables and charts.
And the app has a REST API so you can get the reports from Jira UI or via REST.


Timepiece - Time in Status for Jira
EmreT
You must be a registered user to add a comment. If you've already registered, sign in. Otherwise, register and sign in.
Hi @Jahnavi Pathak,
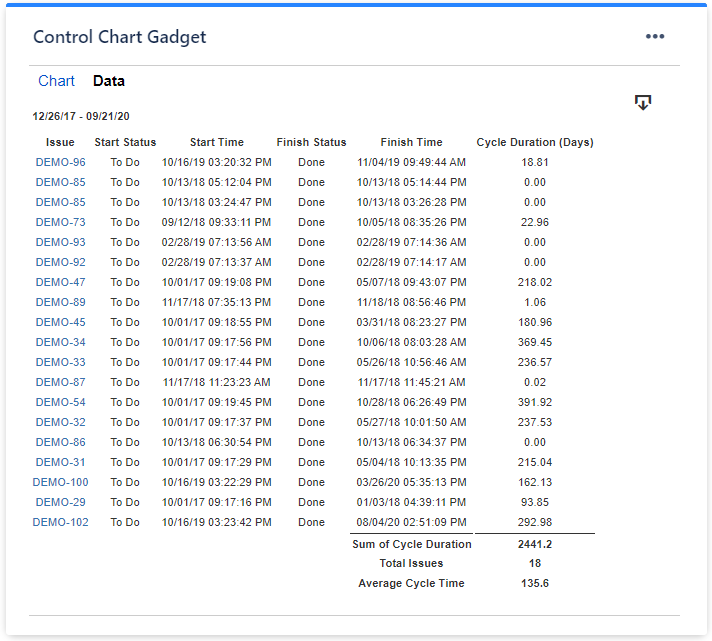
For calculating the total time you can use the Control Chart gadget offered by our Great Gadgets app. You can configure this gadget to calculate the cycle time as total time (from creation to Done), or as time between two specific workflow statuses.

The gadget displays the issues in plot-scatter diagram, by their cycle time. It shows the overall average, you can click individual issue to see the its details and it allows setting a threshold to easily identify the issue that took too long (the ones in red color).
This gadget offers also a Data tab with a detailed report, which you can easily export in CSV.
Please note that this app offers many other useful gadgets, so it can be a great asset for your team. Have a look over the articles from our blog to see how many things you can track with this app.
I hope this helps.
Danut
You must be a registered user to add a comment. If you've already registered, sign in. Otherwise, register and sign in.

You must be a registered user to add a comment. If you've already registered, sign in. Otherwise, register and sign in.