Community resources
Community resources
Community resources
Epic % complete - need to show EPIC PROGRESS / EPIC % completed
Epic % complete - need to show EPIC PROGRESS / EPIC % completed
can this be done in JIRA CLOUD (SOFTWARE)? Please explain if it is possible and HOW?
1 answer
Hi @eleanor kerman,
There is many different ways to show Epic progress in Jira Software. A lot depends on how you work and what your approach to that is.
If you are working in a company managed project, there is a progress indicator in the epics panel in the backlog of your scrum or kanban board for each epic:

As you can see, both screenshots display the exact same epic on exactly the same board. On the left hand side you can see progress displayed, while on the right hand side there isn't any. This is entirely related to the estimation statistic configured in your board settings. The screenshots come from a sample instance of my own, where I don't estimate issues (not in story point, not in time). Progress on the left is based on issue count, where the one on the left is based on time estimates. If you don't estimate, you don't see progress in that case.
A second place where you can see Epic progress, is on the basic roadmap:
Progress here is always based on issue count, so not very precise if you're using time or story point estimates.
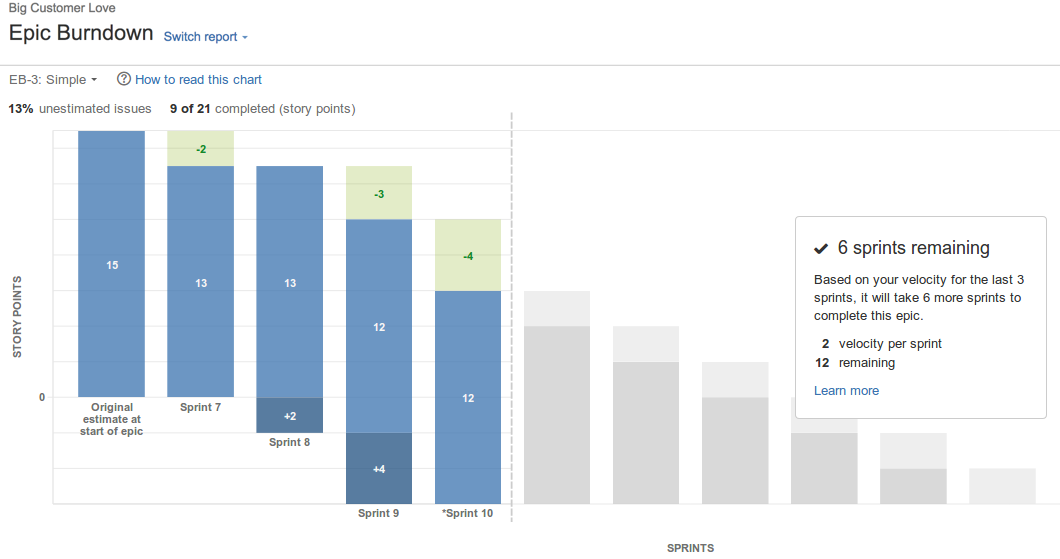
On a scrum board, you have access to this sprint burndown report. This does not only give you insights into actual progress, but it also shows you the history of your epic through past sprints. And on top of that, has a forecast of sprints remaining, based on past performance and remaining estimate. This report does require you to have estimates on your issues.
If you are on a premium plan, you also have advanced roadmaps at your disposal. There is a progress indicator available for all issues as you can see here:

In other words, a lot of options. Hope this helps!


You must be a registered user to add a comment. If you've already registered, sign in. Otherwise, register and sign in.