Community resources
Community resources
Community resources
We are reinventing the Sprint burndown for next-gen projects!
-
Do you have a hard time meeting sprint commitments?
-
Do you want to know the accuracy of your sprint’s estimations?
-
Do you want to have an easy way to report your team’s performance to management?
If the answer to any of these questions is yes, then you’ll benefit from applying the reimagined Sprint burndown chart for next-gen projects to your sprint.
We reinvented the Sprint Burndown. 
We heard that you loved using the chart in the Burndown chart in classic projects to see whether there are any scope changes that impacted the sprint.
We also heard that you loved using the sprint summary (called the Status Report) table in the Sprint report in classic projects for team retrospectives and stakeholder reporting.
-
What is important to you is anything that might impact sprint commitments, how you’re tracking towards sprint goals and how you can improve your team in future.
-
Majority of you use both reports, and you loved that they were either helping you to remove blockers during your daily stand-ups or when you were reviewing how your sprints went.
-
There was duplication in functionality and an increased cost for new users in learning how to use and for us in maintaining these 2 reports.
Taking the best elements from the Sprint report and the Burndown chart in classic projects, we are releasing the Sprint burndown chart for next-gen projects, while introducing new functionality that helps you visualise your team's performance better.
What is this report? 
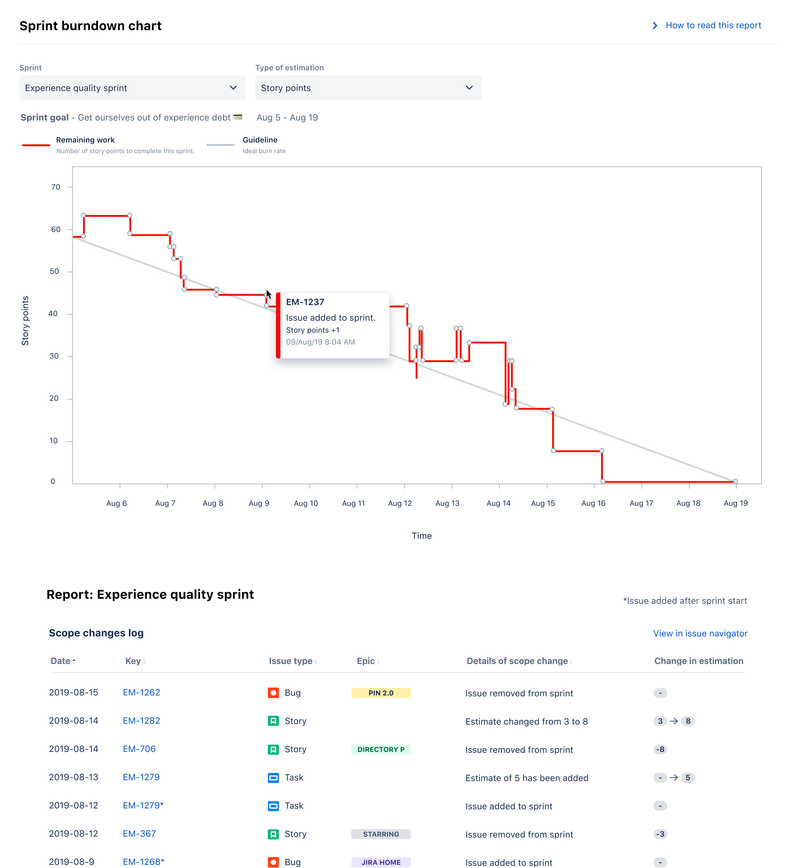
The Sprint burndown chart shows the total work remaining for the current sprint, and the likelihood of your team completing the sprint on time. It also shows a summary of scope changes and work done throughout the sprint, enabling it to be used in sprint retrospectives.
This report will help you:
-
Track the total work remaining and determine the likelihood of achieving the sprint goal. This helps your team manage its progress and respond accordingly.
-
Understand the work completed or pushed back to the backlog in each sprint. This helps you determine if your team is overcommitting or if there is excessive scope creep.
How do I read it?
-
Estimation statistic: The vertical axis represents the estimation statistic that was selected. Currently, only story points exist for the estimation of each issue. Issue count can also be used.
-
Remaining work: The red line represents the total amount of work left in the sprint, according to the team's estimates. This is reflected through the estimation values linked to the issues.
At the start point, the actual work remaining is the same as the ideal work remaining. As time progresses, the actual work line fluctuates above and below the ideal line depending on this disparity between estimates and how effective the team is.
-
In general, a new point is added to this line each day of the project. Each day, the sum of the time or story point estimates for work that was recently completed is subtracted from the last point in the line to determine the next point.
Guideline: The grey line is approximation of where the team should be, assuming linear progress.
-
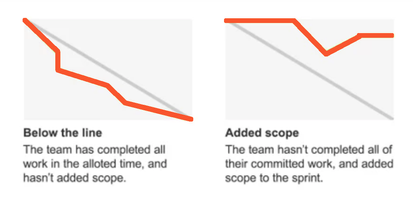
If the red line is below the guideline, the team's on track to completing all their work by the end of the sprint, as there is less work left than originally predicted and the project is ahead of schedule.
-
If the red line is above the guideline, it means that there is more work left than originally predicted and the project may be behind schedule.
-
The guideline is a straight line that connects the start point to the end point.
-
At the start point, the guideline shows the sum of the estimates for all the remaining work.
-
At the end point, it intercepts the x-axis showing that there is no work left to be completed.
-
This line is a mathematical calculation based on estimates before the sprint started, and the estimates are more likely to be in error than the actual remaining work.
-
What did we reimagine for the Sprint burndown chart?
Discover what impacted your ability to deliver your sprint goals. 
-
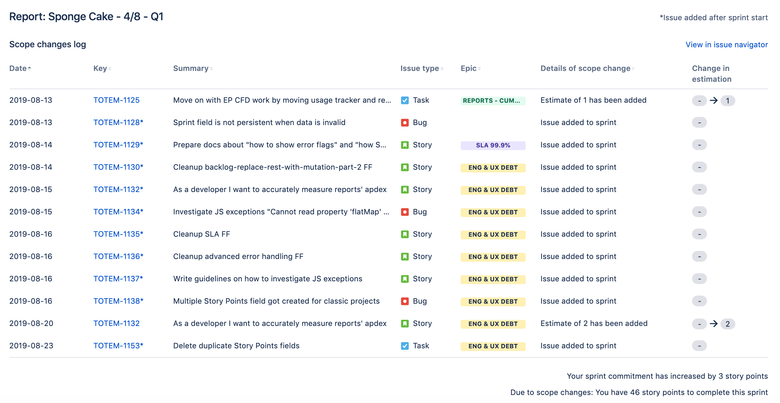
A new section after the sprint begins to log scope changes such as:
-
Issues removed from and added to sprint.
-
Estimation changes for issues in sprint.
-
Visualise the data in the way you deem best, drilling down by sorting. 
-
New columns for epics and assignees, with the new ability to sort by columns to visualise the progress for each epic and assignee, so that you can unblock developers for high priority epics.
Refresh your eyes with modern design patterns. 
-
We introduced a fresh coat of paint using colors and patterns from our Atlassian design system.
How do I get this for my next-gen project?
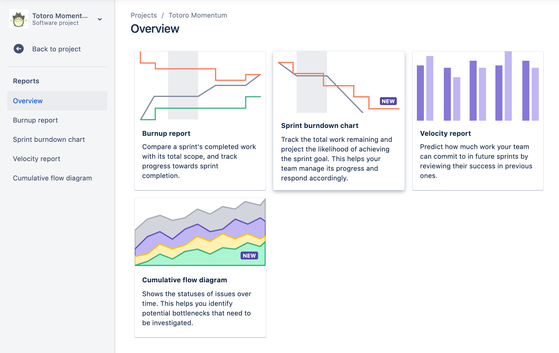
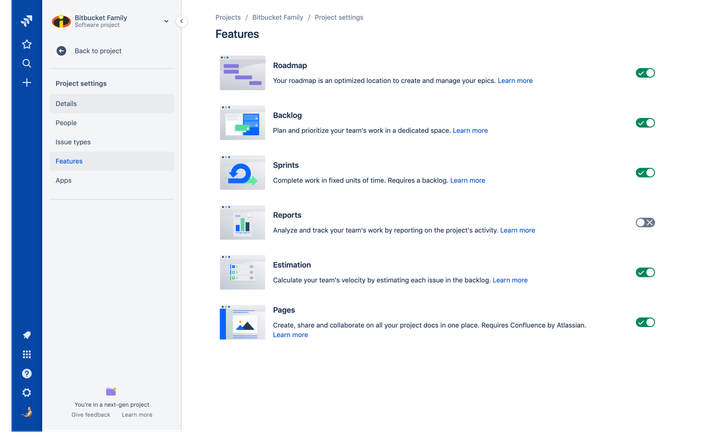
If your project has Reports enabled, you’ll be able to start using it right now.
If not, navigate to Project settings > Features and toggle the Reports feature.
What’s next?
We’ll be monitoring usage and feedback to help us understand the value you’re getting from this report, as this will help us prioritize improvements.
-
Please feel free to reach out to our support team if you have any suggestions.
-
Here is some support documentation on what's available right now for the report.
Was this helpful?
Thanks!
Ivan Teong

About this author
Product Manager, Jira Software
Atlassian
Sydney, Australia
6 accepted answers
Community showcase
Atlassian Community Events
- FAQ
- Community Guidelines
- About
- Privacy policy
- Notice at Collection
- Terms of use
- © 2025 Atlassian



16 comments