Community resources
Community resources
Community resources
Introducing Report Builder - one of the greatest app for custom Jira scripts

Report Builder: What it is & what it does
All organizations which are working with Jira have some reporting needs. With different reports you can improve project management, team performance, forecasting and progress tracking based on real-time, visual data. For some companies the most valuable reports are personal and team reports, which improve employee’s productivity and keep teams on track. And of course, every company has it’s own unique reporting needs. Some reporting functions can be found in Jira out-of-the-box. But if you want something unique and flexible, you need an app like Report Builder.
Report Builder helps organizations with any type of Jira reporting need. The app has built-in personal and time reports templates, which cover most reporting needs. In the section Scripted Reports you will also be able to build reports from scratch, by implementing any type of calculation algorithm, parameter and visualization library. Build your own report with HTML and JavaScript basics.
Reporting essentials in Report Builder
- You fill in some report parameters, like scope, dates, etc.
- You get raw data based on input parameters: projects, tickets, work logs, etc.
- You apply an algorithm to calculate your report based on raw data and input parameters
- You format your results to get the report in table, chart or any other format
Let's build a report
Our example: Actual time vs. estimation
The process of report creation with Scripted Report is split into three tabs:
- General
- Template
- Script
One more tab called Permissions will be useful if you want to share the report with someone, but we’ll cover this part at the end of this guide.
Let’s try to solve the task of getting a time tracking report from Jira based on JQL query and get an understanding of each tab.
Tab 1: General
The tab provides the ability to add input fields and define the category of your report. At the moment there are more than 10 predefined input field types. You can choose any category from the list or skip this step.
In our case, we will choose the category “Table”, because it would be a great way to see the estimated time over the spent time in table format.
We create two input fields:
- JQL: to work with JQL query and get syntax check
- Fields Picker: to select the worklog fields of the Jira issue
We set up those two fields the following way:
- Field Name: We choose a field name that will be part of the “name” HTML tag and will be used for script logic.
- Title: We choose a title that will be shown at the top of the field.
- Type: We choose a type that will predefine the behaviors of the field (syntax check or Jira object select).

Tab 2: Template
To control the final data view, the Template tab provides a Handlebars template editor. If you’re not aware with Handlebars, we’re suggesting to check out the official site of the template engine.
As mentioned before, we decided to use the table format to represent the data. We assume that it will be an array of issue objects which come from Jira API, so we need to create a table row for each of these objects.

Tab 3: Script
To manage the data provided, you can use JavaScript in the General tab. The code will run in the top-level await scope with the defined SR object. This object is constructed to help with tasks like interacting with Jira API, easily getting data from the input fields of the General Tab and passing the final data to the template.
Let’s go over some of these methods:
SR.getValueByFieldName(fieldName:String) – returns the input field value based on fieldName string parameter
SR.getIssuesByJQL(jql:String, <fields:String>) – returns an array of Jira issues based on JQL query and the list of comma-separated fields. If the fields parameter is not set, then Jira Navigable fields will be returned
SR.render(templateValues:Object, <callback:Function>) – passes the values from the JavaScript to the template defined in the Template tab. It is possible to set some after rendering logic with the callback parameter
You fill in the fields JQL and Fields Picker. The first thing you need to do is getting the values in the script.

To get the data from the input fields with the help of SR.getValueByFieldName() you need to pass the field name value that was set in the General tab. Please note that the Fields Picker is a multi-select field which returns an array of values.

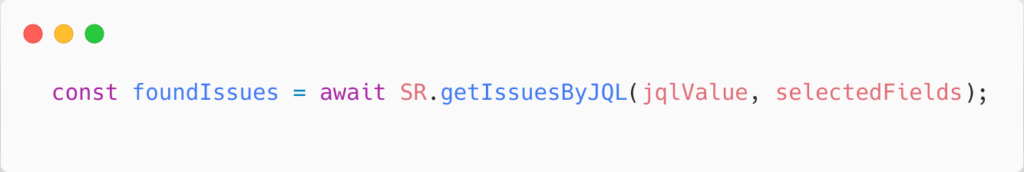
As the SR.getIssuesByJQL() uses the string type for both parameters, you convert the selected fields to the comma-separated string. As the request to the Jira API is an asynchronous operation, you should be using top-level await to wait for a response.
Now, fetch the Jira issues and control the final data object. This is possible with the JavaScript map() method:

The issue in the last code shows the time that comes from Jira and is presented in milliseconds. So you need to define the helper function that will convert incoming values into hours.
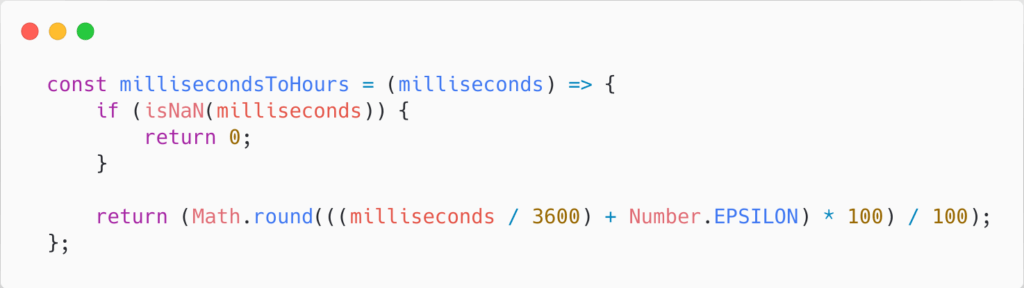
You now need to apply this conversion to the map callback function.

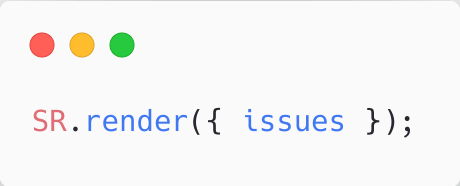
Finally, you’re passing the value of the issues as part of the rendering object inside the SR.render() method. If you want to pass more values, you need to add another property to the rendering object.
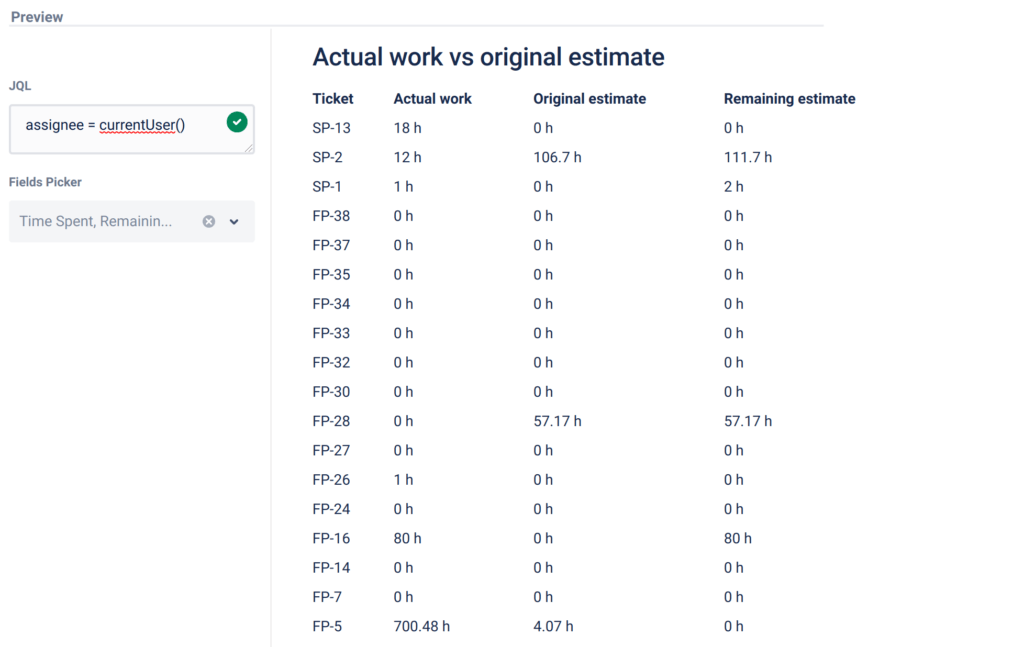
All you are now left with is clicking on the “Get Report” button at the top-right and view the results.
Here you can see the complete code for the Script tab:

Permission tab
To regulate the group of users that could view, edit and admin your report, you can configure the Permissions tab. The selected users will see the shared report in the “Shared” tab in the Scripted Report dashboard.
Currently, there are three roles of report users available:
1. View access – the user has the ability to only view the report. The user cannot save the input parameter values or edit the report configuration tab.
2. Edit access – the user has the ability to view the report and save the input parameter values. The user cannot edit the report configuration tab.
3. Admin access – the user has the ability to view the report, save the input parameter values and edit the report configuration tab.
The creator of the report always has admin access rights! Creator rights cannot be changed.
The Permissions tab allows sharing the direct link to the report. Please note that the respective user should have permission to at least view the shared report (role 1).
Saving your report
When the report set up suits your goals, save your report and choose a self-descriptive name. You will find all your report in the Scripted Report dashboard in the tab “My reports”
Report improvements: Changing the script
You already know how to get the spent time in comparison to the estimated time for issues. But what if you want to get a report that will calculate the work time for a whole project, so multiple issues from multiple users? This can be achieved with minor changes in the report script.
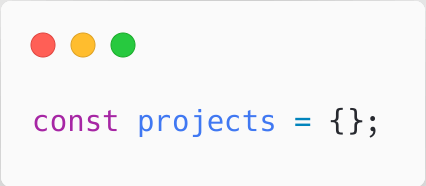
First, you need to define the object that will store each project worklog as a key-value pair.
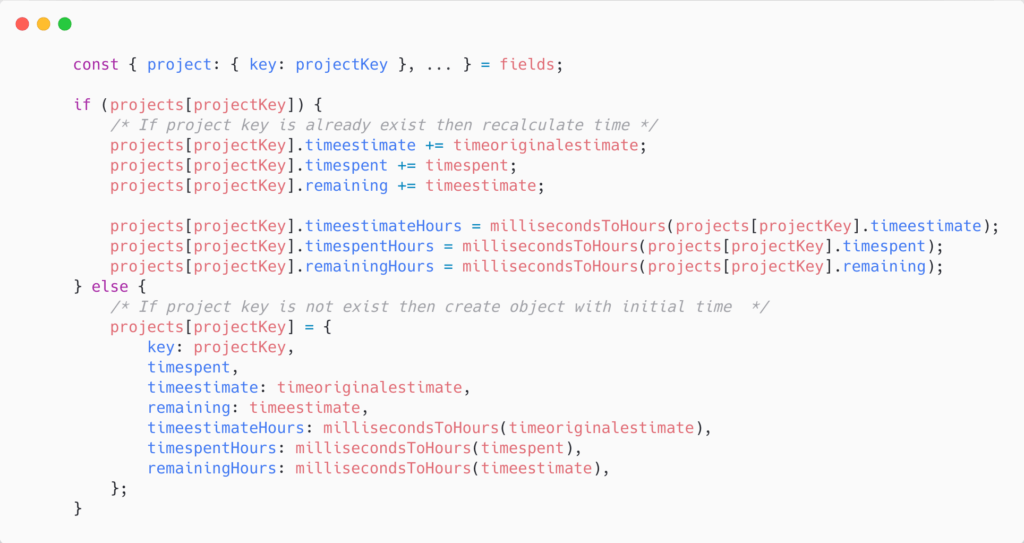
Next, pick the project field in the Fields Picker to be returned from the Jira API. Define the calculation logic inside the foundIssues.map() callback:
Finally, pass the “projects” object as part of the rendering object and update the Template tab to show the data.


These operations will show you the report with extended data.

Please note that you didn’t lose the previous report, but calculated project logs in addition to it. This shows the flexibility of Scripted Reports, to fetch and use the Jira data in multiple ways.
Example of the code
Template:

Script:


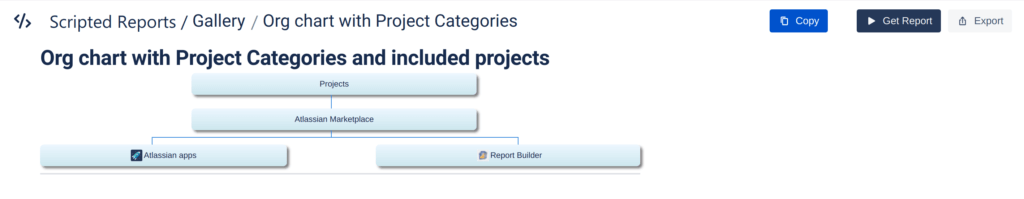
Using the report gallery
The integrated report gallery is a list of predefined reports. The predefined gallery reports cannot be edited, but you can copy them into your private report list for editing.
To copy the report, please click the button “Copy” at the top-right of the report viewing page. Right after the click your report will be created automatically in your “My Reports” tab of the Scripted Report dashboard.
If you have any further reporting needs, please contact our Report Building Service team, which will provide any report for you.
Test Report Builder 30 days for free and discover your possibilities. Already available on the Marketplace.
Was this helpful?
Thanks!
Andrei Pisklenov _Actonic_
About this author
Head of Development
Actonic
Germany
3 accepted answers
1 comment