Community resources
Community resources
Community resources
How to measure productivity of teams & quarters?
Reporting with Report Builder
How many billable hours has my team logged for a specific project? Was the last month or quarter productive and how does it compare to the one(s) before? In order to measure productivity of employees or teams and to create correct invoices with billable hours you need a system that entails a connection between logged hours, projects, users and time periods. A system like Report Builder – our time tracking and reporting app. Because only with transparent and complete timesheets and reports, which are linked to one specific project or client, you will be able to create correct invoices. The same goes for quarterly reports. In an ideal world, users would be easily able to complete every step of the journey. Find out how those steps could look like with Report Builder!
We already named two use cases, which were relevant when we developed Report Builder:
- How many billable hours has my team logged for a specific project?
- Was the last month or quarter productive and how does it compare to the one(s) before?
Real scenarios could be:
- A leader would like to check the total amount of billable hours for his team or project and create invoices.
- For a future works meeting a team lead wants to compare the last quarters and present the results.
- A big project with multiple members and Jira issues has been completed. Now billable hours need to be summed up.
How Report Builder works
Report Builder covers every time tracking and reporting need of different users, for example employees, team and project leads.
My Timesheets
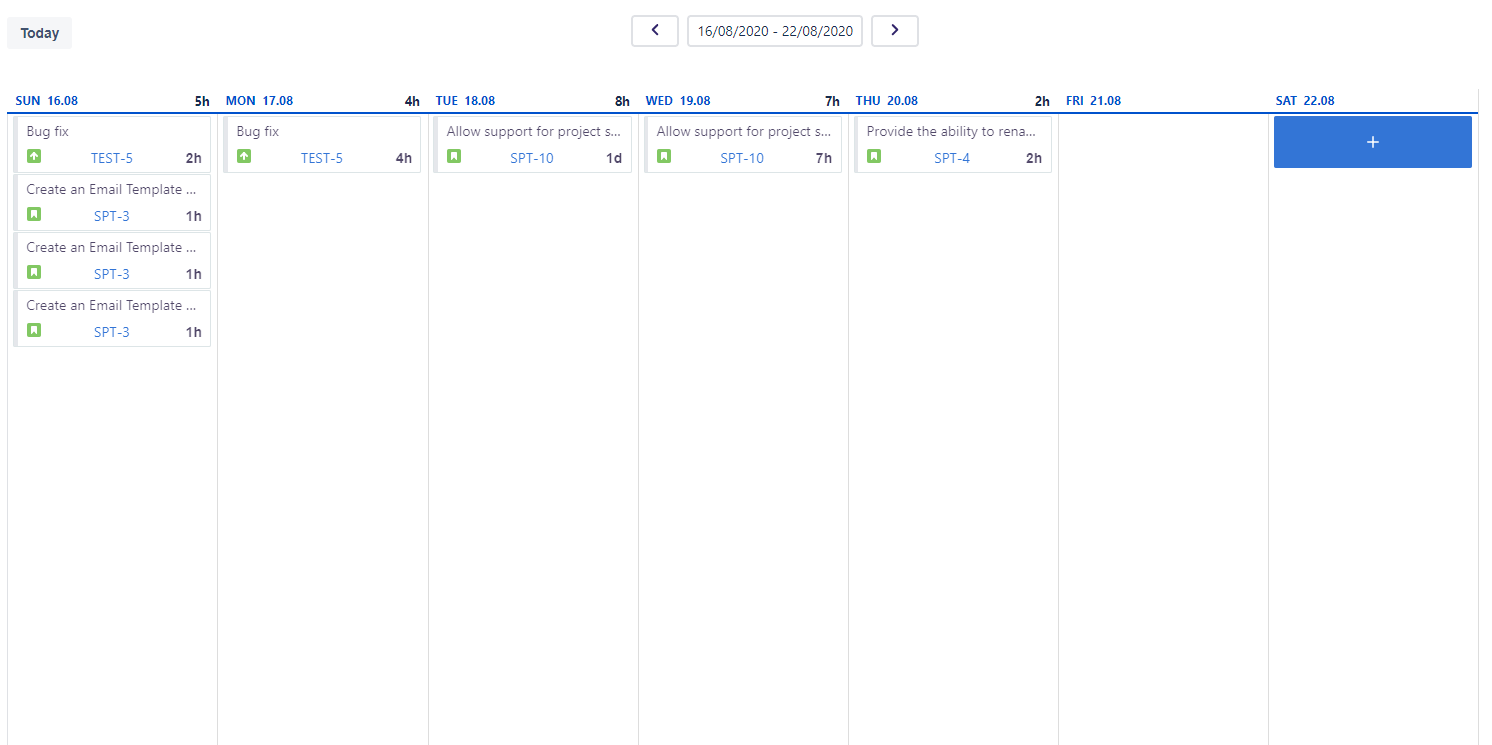
In the section My Timesheets users will find a framework for adding time logs. By using different display modes they will get an overview of their working hours. Via drag-and-drop users will be able to add time logs to their calendar easily. Logged, billable hours are always linked to a specific user and Jira issue. The team lead now has the opportunity to use these timesheets to create a report, which will present total hours.
Teams
Teams serves as a dashboard for groups. Different users can be grouped together and connected to projects in Report Builder. Created teams are possible filters for report creation.
Reports
Getting an overview of logged hours
In the section Reports different templates and formatting options are available. With pre-defined templates users can easily create reports. In Timeline and Pivot reports users will pick specific filters.
For example:
- Filter by: Joe Doe and Test project
- Period of time: Last month
The report will now collect logged working hour for the selected user Joe Doe, which were added last month and are linked to the Jira project Test project. This task can be expanded to teams, by creating a team in the teams section and using it as a filtering option.
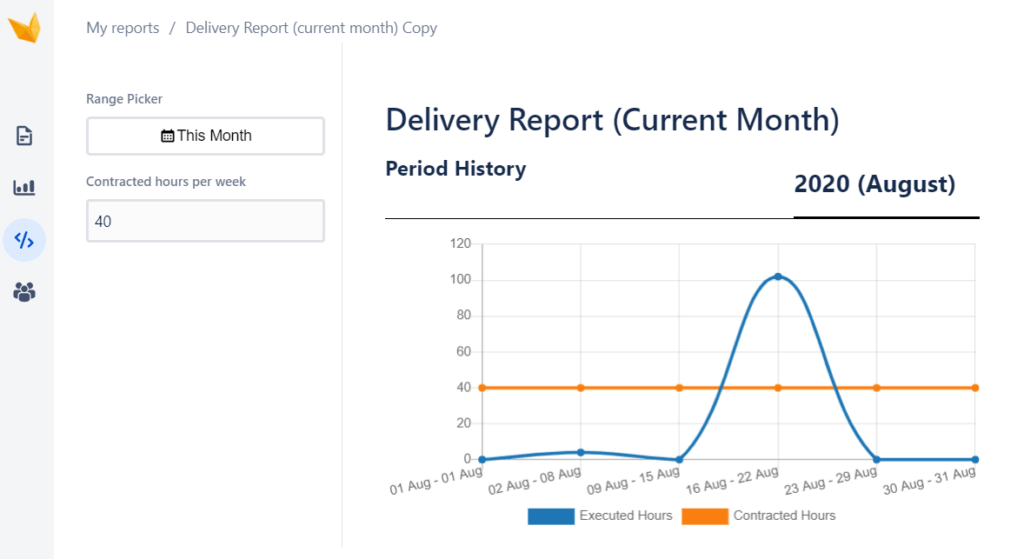
Would a user like to compare the logged hours with contracted ones, he could choose the gallery template Delivery Report. This report template visualizes logged and contracted hours, which serves as another indicator for productivity as well.
Comparing periods of time
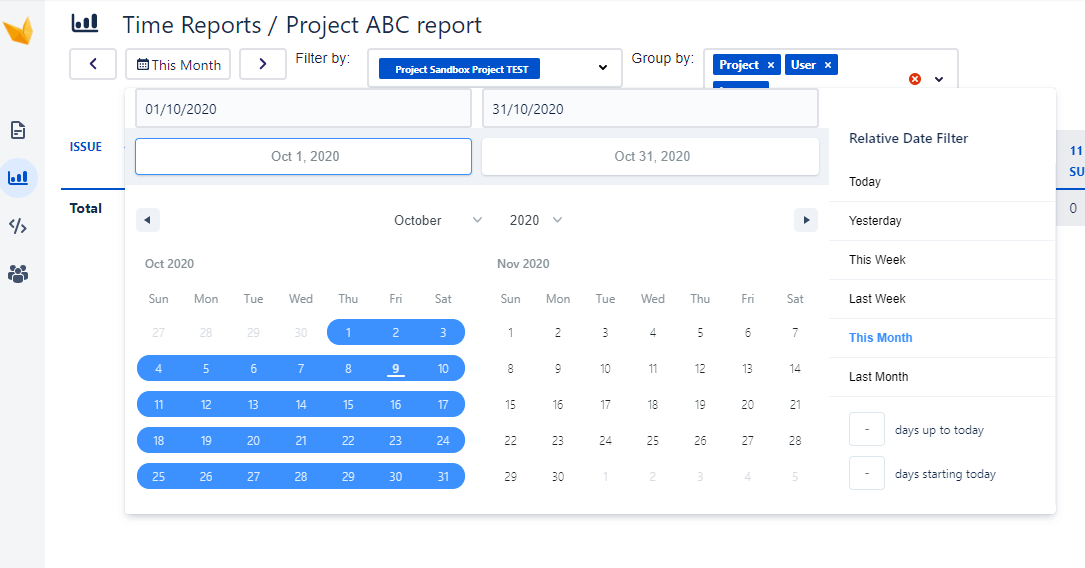
In order to compare total hours for different periods of time, users have the option to effortlessly pick different dates with the relative date filter and compare total hours by switching between them and monitoring the amount of total hours.
A user can also build his own two reports by using our integrated framework. It is possible to do that choosing the same script and the same filters for user and project, but picking two different time frames.
Test Report Builder 30 days for free and discover your possibilities. Already available on the Marketplace.
Was this helpful?
Thanks!
Andrei Pisklenov _Actonic_
About this author
Head of Development
Actonic
Germany
3 accepted answers


2 comments