Community resources
Community resources
Community resources
how to analyze single bug solution time in dashboard?

is anyone know if there exist plug-in in jira dashboard can be used to analyze the every bug solution time in intuitive way
like Abscissa is bug Name(or Link), Y-axis is solution time(Solution time - Create time= solution time) for this bug.
I know there's a plugin in jira, but can only calculate average resolution time

5 answers
Hi @Qin Zhang
Welcome to Atlassian Community!
If lead time(time interval between the moment an issue(or a bug) is requested to the moment it is completed) is what you need, you can try Status Time Reports app developed by our team.
Here is the online demo link, you can see it in action and try without installing the app. For your case, you can have a look at Lead Time for Each Issue report.
For more detail, you can have a look at Cycle Time and Lead Time in Jira: Productivity Measurement with Two Critical Parameters article and Status Time Reports How to Videos.
If you are looking for a completely free solution, you can try the limited version Status Time Free.
Hope it helps.
Hello @Qin Zhang
If you are OK with using a marketplace app for this, our team at OBSS built Timepiece - Time in Status for Jira for this exact need. It is available for Jira Server, Cloud, and Data Center.
Time in Status mainly allows you to see how much time each issue spent on each status or each assignee. You can use this app to analyze each issue individually or get averages.


You can combine the time for multiple statuses to get metrics like Issue Age, Cycle Time, Lead Time, Resolution Time etc.
For all numeric report types, you can calculate averages and sums of those durations grouped by the issue fields you select. For example total in-progress time per Vertical or average resolution time per sprint, week, month, issuetype, request type, etc. The ability to group by parts of dates (year, month, week, day, hour) or sprints is particularly useful here since it allows you to compare different time periods or see the trend.

The app calculates its reports using already existing Jira issue histories so when you install the app, you don't need to add anything to your issue workflows and you can get reports on your past issues as well. It supports both Company Managed and Team Managed projects for Jira Cloud.
Time in Status reports can be accessed through its own reporting page, dashboard gadgets, and issue view screen tabs. All these options can provide both calculated data tables and charts.


Timepiece - Time in Status for Jira
EmreT
You must be a registered user to add a comment. If you've already registered, sign in. Otherwise, register and sign in.
Hi @Qin Zhang,
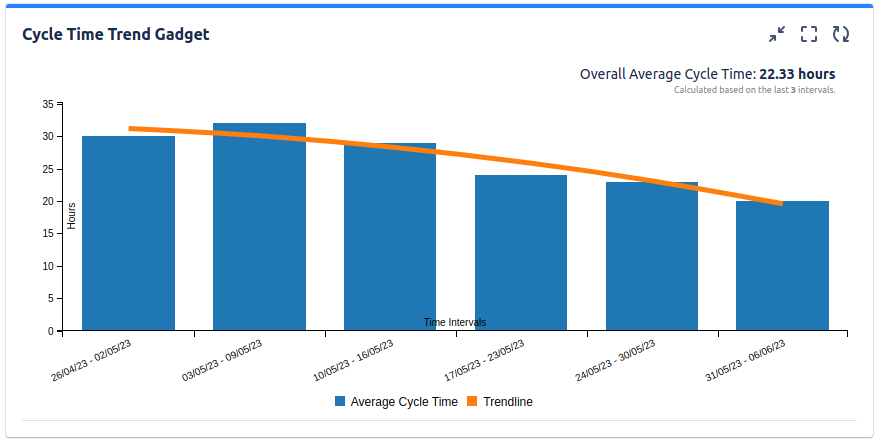
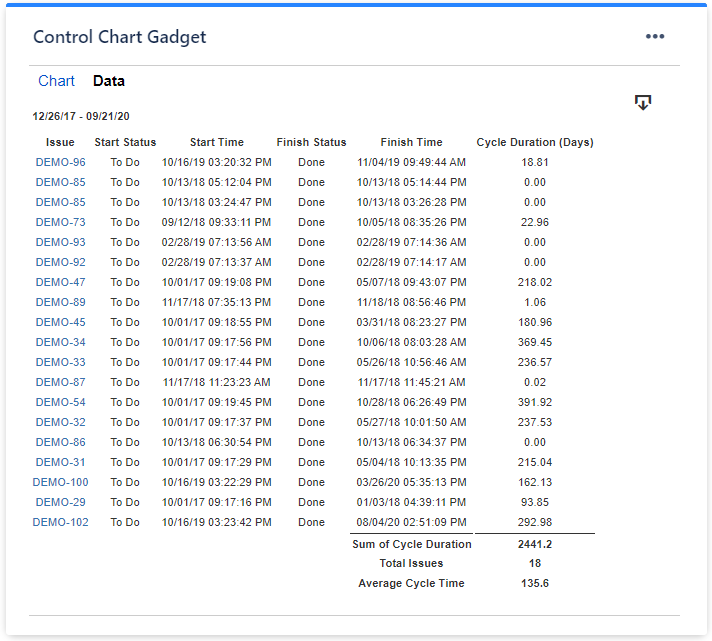
Try our Great Gadgets app. It offers many gadgets, including some that allows you to calculate the cycle time (from in progress to done), lead time (from creation to done) or time between two statuses.
You can have the result displayed in various ways: Trend Chart, Control Chart, Histogram Chart.
See more details in this blog post.
Each gadget offers also a data table with details on every issue.
If you have questions, feel free to contact us at support@stonikbyte.com.
Thank you,
Danut M.
You must be a registered user to add a comment. If you've already registered, sign in. Otherwise, register and sign in.
Custom Charts for Jira comes with up to 4 dashboard gadgets that users can add (depending on their hosting, 3 or 4).
Custom Charts for Confluence is the sister app, which is a fully-featured Confluence app that allows users to add the same charts as Confluence page macros rather than dashboard gadgets.
Full disclosure: I work for a company (Tempo) that is affiliated with the makers of these products (Old Street Solutions). Custom Charts may not be the only possible solution, so I recommend you conduct your own search of the Atlassian Marketplace.

Hoe this helps,
-dave
You must be a registered user to add a comment. If you've already registered, sign in. Otherwise, register and sign in.

Hi @Qin Zhang ,
sure thing! You could use our reporting plugin Exply for this :) You can visualize way more than this if you like and come up with completely interactive Dashboards for every kind of report:

If you like we can also schedule a quick demo call to show you around :) Just hit me up via fabian@exply.io
Fabian from Exply
Head of Product
You must be a registered user to add a comment. If you've already registered, sign in. Otherwise, register and sign in.
thanks for your kind reply, does this plugin integrate in jira dashboard? I can not find it through clicking "Add gadget "

You must be a registered user to add a comment. If you've already registered, sign in. Otherwise, register and sign in.
Hi @Qin Zhang,
Did you add Exply via the Atlassian marketplace? --> reporting plugin Exply
After you have done that you can create custom Dashboards in the Exply App and add them to your Jira dashboard using the sharing option in Exply :)
Cheers,
Fabian
You must be a registered user to add a comment. If you've already registered, sign in. Otherwise, register and sign in.

You must be a registered user to add a comment. If you've already registered, sign in. Otherwise, register and sign in.