Community resources
Community resources
Community resources
How to acesss a overview of all projects in my team?
My workspace involves working with third parties and managing four or five projects simultaneously. As a project manager, I would like to have a dashboard that displays the progress (%), people involved in each project, tasks, and other relevant information for all projects. Is it possible to achieve this in Jira?
3 answers
1 accepted
Hi @Lucas Palheta
Welcome to the Atlassian Community.
There was a question similar to yours a few months back and the recommendation was to create a Kanban board and use a filter for all your four or five projects. They also go into monitoring more than one project on a dashboard.
Here's the original question (see the first answer) https://community.atlassian.com/t5/Jira-Software-questions/Overview-of-multiple-projects/qaq-p/2539359
I hope this helps,
Michael
Hi, Michael!
I tried the solution and it works so well with my team. Now, I can see the project status, tasks per team member, and more. And, in the menu of the kanban board that I created, the Report option shows me a dashboard with all my projects. It's just to configure in the tab.
Thanks :)
You must be a registered user to add a comment. If you've already registered, sign in. Otherwise, register and sign in.
You must be a registered user to add a comment. If you've already registered, sign in. Otherwise, register and sign in.
Hi @Lucas Palheta,
I am Marlene, product manager of Quick Filters for Jira Dashboards.
It's great to hear that you found a solution to your problem by working with a Kanban board.
If you want to add also a cross-team dashboard in future, you could check out our app. With Quick Filters you can add a Quick Controller to your dashboard to filter it dynamically, e.g. per Jira project.
You can checkout our app without installation on our demo dashboards.

You must be a registered user to add a comment. If you've already registered, sign in. Otherwise, register and sign in.
It's Mary from Planyway for Jira: workload, roadmapping, time tracking
Yes, it's possible to achieve this in Jira through the use of dashboards and gadgets. Jira dashboards can be customized to display a wide range of information about your projects, which can help you manage multiple projects and keep track of progress, tasks, and team members involved. Here's how you can set up a dashboard in Jira to display the progress, people involved in each project, tasks, and other relevant information:
1. Create a New Dashboard
- Go to Dashboards in the top navigation bar and select Manage Dashboards.
- Click on Create dashboard.
- Give your dashboard a name and a description that reflects its purpose.
- Choose whether you want to keep it private or share it with others.
2. Add Gadgets
Once you have your dashboard, you can add gadgets to display the specific information you need. Here are some gadgets that might be useful for your requirements:
-
Project or Filter Results Gadget: Use this to display issues from a specific project or based on a particular JQL (Jira Query Language) filter. You can configure it to show tasks for each project.
-
Pie Chart Gadget: This can show the distribution of tasks by status, assignee, or other fields, giving you a quick overview of the progress and involvement.
-
Two Dimensional Filter Statistics: This gadget can display a table breaking down issues by two fields, such as project and assignee, or project and status, helping you see progress and who is involved in what.
-
Roadmap Gadget (if using Jira Software): Use this to display the roadmap for your projects, showing key dates and progress.
-
Activity Stream: This shows recent activity across your projects, such as task updates and comments.
-
Workload Pie Chart Gadget: This can help you visualize the workload of your team members across different projects.
3. Configure Gadgets
Each gadget will need to be configured to display the specific data you're interested in. This might involve:
- Selecting the projects or filters the gadget should pull data from.
- Choosing which fields or issue types to display.
- Configuring the display options, such as the number of items to show.
4. Share Your Dashboard
Once you've set up your dashboard, you can choose to share it with your team or other stakeholders. This can be done through the dashboard's configuration settings, where you can manage permissions and shares.
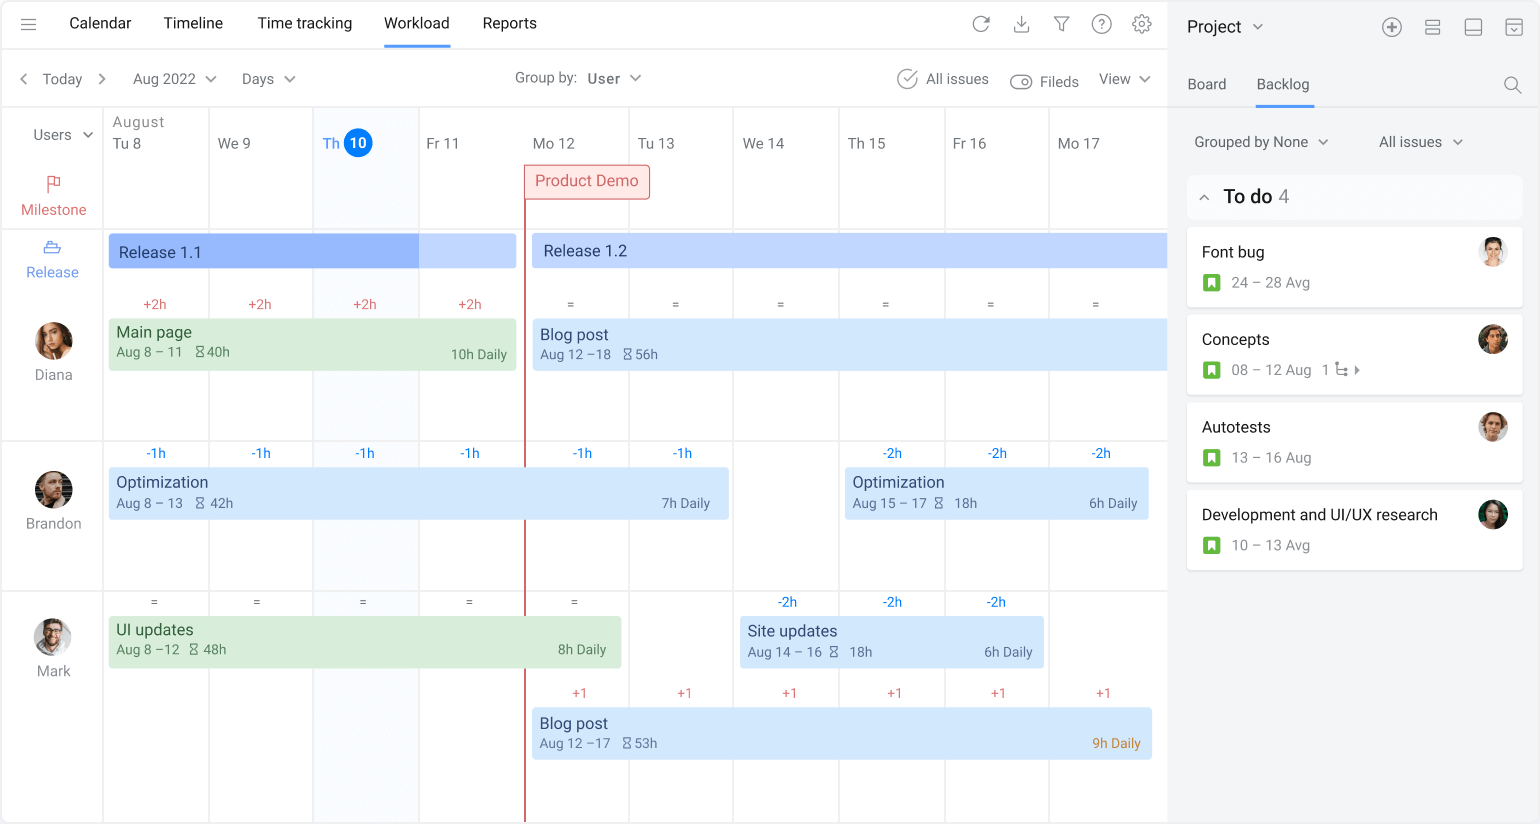
Also, you may consider using the tool like Planyway to get the visual representation of your team workload.
You must be a registered user to add a comment. If you've already registered, sign in. Otherwise, register and sign in.
I appreciate your suggestions. I tried to do this before posing the question, but the gadgets have a filter only for each project, not for all projects. And, the Planyway looks great, but I'm looking for a pie chart's. Thanks :)
You must be a registered user to add a comment. If you've already registered, sign in. Otherwise, register and sign in.
Planyway works across multiple projects, you can connect them in the left sidebar. But you're right, a pie chart is not something we have.
You must be a registered user to add a comment. If you've already registered, sign in. Otherwise, register and sign in.

You must be a registered user to add a comment. If you've already registered, sign in. Otherwise, register and sign in.