Community resources
Community resources


- Community
- Products
- Jira Software
- Questions
- How can I report on the time it takes for an issue to be resolved once it has been moved to active?
How can I report on the time it takes for an issue to be resolved once it has been moved to active?
I have checked out the resolution time report but it seems that that report shows from date created to date resolved. I have also checked out the control chart, but it appears that the timer on each status is reset if an issue is pushed back. (for example if an issue is "In Dev" for 3 days and then is moved to "QA" and then moved back to "In Dev" it no longer shows as being "In Dev" for 3 days, its reset). Any ideas?
4 answers
2 accepted
Hello @Brandon Fay
As you said, you can use the built-in Control Chart (that is available as part of Kanban Board reports) about this but it is not very good with reopens. It also will show you the duration but it does not show individual issues. It is more aimed towards seeing the big picture.
You can also try the built-in Average Age Report or Resolution Time Report. Both are available under project reports or as dashboard gadgets. Unfortunately, both reports also are very high level. They just show daily average data. Average Age Report excludes resolved issues and Resolution Time report excludes non-resolved issues.
If you are interested in a very flexible custom solution, our team at OBSS built Time in Status app for this exact need. It is available for Jira Server, Cloud, and Data Center.
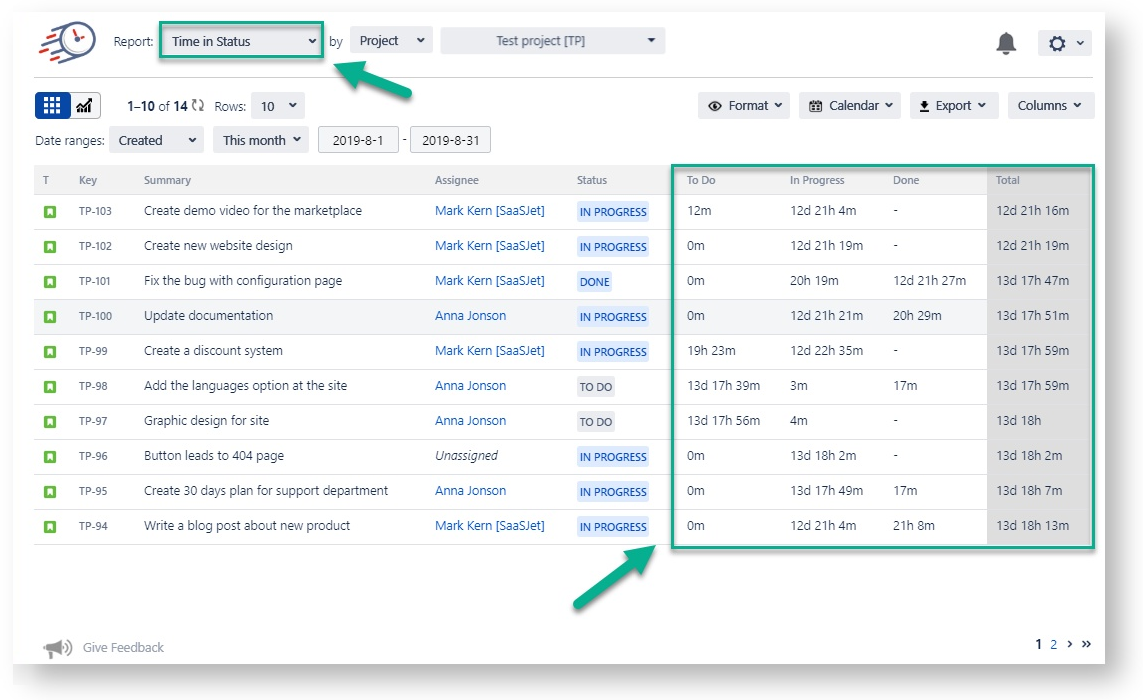
Time in Status allows you to see how much time each issue spent on each status or assigned to each assignee. You can also combine statuses into consolidated columns to see metrics like Ticket Age, Resolution Time, Cycle Time, or Lead Time. For example, you can add a column to the report that includes all statuses in your workflow (except resolved and closed) and see the total time between creation and resolution of the issue.
You can calculate averages and sums of those durations grouped by the issue fields you select. (For example, see the total InProgress time per Epic or average Resolution Time per issue type).


The app calculates its reports using already existing Jira issue histories so when you install the app, you don't need to add anything to your issue workflows and you can get reports on your past issues as well.
Using Time in Status you can:
- See how much time each issue spent on each status, assignee, user group and also see dates of status transitions.
- Calculate averages and sums of those durations grouped by issue fields you select. (For example, see average InProgress time per project and per issue type.)
- Export your data as XLS, XLSX, or CSV.
- Access data via REST API. (for integrations)
- Visualize data with various chart types.
- See Time in Status reports on Jira Dashboard gadgets (released for cloud, server&DC gadget coming soon)
https://marketplace.atlassian.com/1211756
EmreT
Hi @Brandon Fay
If you would be interested in a third party solution, you may want to try out our plugin, Agile Tools : Epic Tree & Time in Status
The add-on provides the time spent in each status for the entire lifecycle of the issue. You can also extract the transitions history of the issue. Along with various Issue stats reports, you get additional features like Epic Hierarchy & Links Hierarchy to track the project's progress. The main features are as below
- More than 7 types of Time in Status Reports. Excel Export available for all status reports.
- Time in Status
- Time with Assignee
- Time in Status with Assignee
- Time with Assignee per Status
- Status/Assignee Count
- Multiple Transition Reports
- Avg Time reports
- Epic Hierarchy / Sum Up (Standard Jira Hierarchy Epic -> Story -> SubTask)
- Link Hierarchy / Sum Up (Hierarchy based on your issue link, upto 10 level deep)

You must be a registered user to add a comment. If you've already registered, sign in. Otherwise, register and sign in.
Hi @Brandon Fay
You can also check out Time in Status for Jira Cloud app developed by my team. This add-on counts all time in each status, and it can't be reset. You can try the demo version without installing it. That's how Time in Status report will look like:
You must be a registered user to add a comment. If you've already registered, sign in. Otherwise, register and sign in.
Hi @Brandon Fay ,
As an alternative, you can try Status Time app developed by our team. It provides reports on how much time passed in each status as well as status entry dates and status transition count.
Once you enter your working calendar into the app, it takes your working schedule into account too. That is, "In Progress" time of an issue opened on Friday at 5 PM and closed on Monday at 9 AM, will be a few hours rather than 3 days. It has various other reports like assignee time, status entry dates, average/sum reports(eg. average in progress time per project). And all these are available as gadgets on the dashboard too.
Here is the online demo link, you can see it in action and try.
If you are looking for a free solution, you can try the limited version Status Time Free. Hope it helps.
You must be a registered user to add a comment. If you've already registered, sign in. Otherwise, register and sign in.

Was this helpful?
Thanks!
DEPLOYMENT TYPE
CLOUDPRODUCT PLAN
STANDARDPERMISSIONS LEVEL
Site AdminCommunity showcase
Atlassian Community Events
- FAQ
- Community Guidelines
- About
- Privacy policy
- Notice at Collection
- Terms of use
- © 2024 Atlassian
You must be a registered user to add a comment. If you've already registered, sign in. Otherwise, register and sign in.