Community resources
Community resources
Community resources
Customer Satisfaction Statistic Type or Gadget?

Hi Y'all!
I am wanting to add the best way to visualize the average customer satisfaction rating in Jira dashboards. I see that the most relevant "Statistic Type" is Plugin Rating. Unfortunately this simply gives the count/number of completed customer satisfaction surveys, not the average.
Is there a different "Statistic Type", "Value", or Gadget that would provide this information in the best visualization?
Thanks!
Ale

2 answers
Hi @adamea,
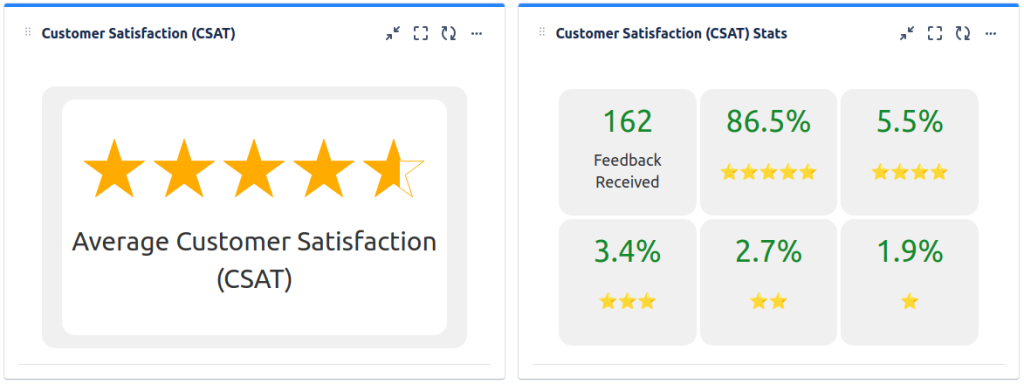
This is possible with our Great Gadgets app for Jira.
With its Issue Filter Formula gadget you can display the Average Satisfaction Score as a number or on a 5-star scale. With the Advanced Issue Filter formula gadget you can make all kind of calculations against the Satisfaction field of Jira Service Management.
This app offers many other gadgets that you will find useful. See also this blog article:
An effective dashboard for Service Desk and Customer Support teams in Jira Service Management
If you have questions, please do not hesitate to contact us at support@stonikbyte.com.
Regards,
Danut M.
Hi @adamea , welcome to the community! I've been looking for similar issues and right now there isn't anything that I'm aware of using the base code that would average the results. You can access the data in SQL as 'Satisfaction'. There is a JIRA ticket to enhance the JIRA gadget that you can watch and vote for. You can see that here: JSDCLOUD-4835
Hope that helps.
You must be a registered user to add a comment. If you've already registered, sign in. Otherwise, register and sign in.

You must be a registered user to add a comment. If you've already registered, sign in. Otherwise, register and sign in.