Community resources
Community resources
Community resources
Cumulative Flow per sprint
I just want to list the number of ticket of one particular sprint over sprint time grouped and stacked by ticket states. I.e. a cumulative flow diagram that shows tickets from a selected sprint only.
unfortunately i can neither refine the cumulative flow diagram from the project's reports section (it shows _all_ open- and done tickets regardless which time frame i select) nor i can find a cumulative chart gadget that i can use in a custom board.
How can i get that simple cumulative-flow-per-sprint view?
3 answers
2 accepted

Hi @Daniel Tscherwinka -- Welcome to the Atlassian Community!
Have you tried to add a Quick Filter for your specific sprint? That filter may then be selected with the Atlassian interpretation of a CFD to show what you asked.
Kind regards,
Bill
Hey @Bill Sheboy ,
thanks for the quick reply!
i created a simple filter that lists all issues from our open sprints:
project = WOH and Sprint in openSprints()
and added it as a 'custom' filter to our board (there are no options for 'quick filter' as described at https://support.atlassian.com/jira-software-cloud/docs/configure-quick-filters/ so i guess its synonymous)
but unfortunately there is still no filter option besides dates ('Date Filter', 'From date', and 'To date') in the CFD report:
You must be a registered user to add a comment. If you've already registered, sign in. Otherwise, register and sign in.

You are using a team-managed project, aren't you?
Argh...I do not know why Atlassian decided to remove so many features from the reports for team-managed projects.
The alternative suggested by Danut M from StonikByte is a good one; I have used it successfully for years with different teams, and the vendor is quite responsive to help with problems and improvement suggestions. (Disclaimer: I do not work for Atlassian or StonikByte...I'm just a user of Jira.)
Or...to switch to a company-managed project with better reporting.
You must be a registered user to add a comment. If you've already registered, sign in. Otherwise, register and sign in.
ah okay,
indeed this kind of feature restriction makes no sense to me, as the report becomes unusable...
thanks again for the quick clarification :)
You must be a registered user to add a comment. If you've already registered, sign in. Otherwise, register and sign in.
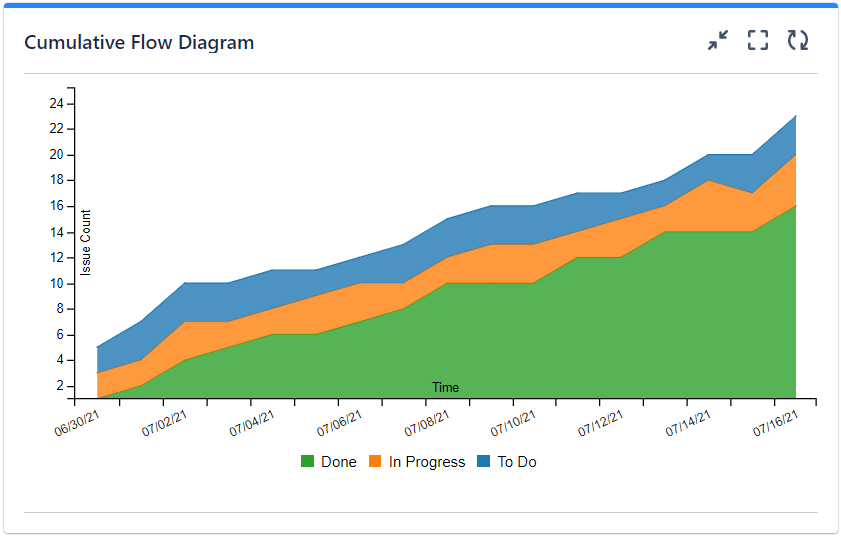
Try the Cumulative Flow Diagram gadget offered by our Great Gadgets app.
It can display the cumulative chart by various criteria (status, status category, issue type, etc) and works by issue count, story points, time estimates etc.

It is based on a filter. All you have to do is to create a Jira filter that returns the issues from the sprint and to configure the gadget to use that filter.
This app offers many other useful gadgets for Scrum, Kanban, SAFe, etc. Just have a look over the articles from our blog to make an idea.

I hope this helps.
Danut.
You must be a registered user to add a comment. If you've already registered, sign in. Otherwise, register and sign in.
Hi @Danut M _StonikByte_ ,
nice! i will have a closer look....
You must be a registered user to add a comment. If you've already registered, sign in. Otherwise, register and sign in.
The suggestion of the marketplace app is a common one but doesn't work when you have an organisation of hundreds of users, since this would cost $500+ a month, which is laughable.
I posted about this previously and it seems that in the two years since, Atlassian hasn't resolved this and has no intention of doing so.
TLDR: CFDs are completely useless in team managed Jira projects.
Your only options are:
1) Move to a company managed project (high setup cost in terms of time, migration etc)
2) Purchase an expensive marketplace app
3) Create an automation in Jira that pushes data to an external Google Spreadsheet when a ticket status is updated where you can then create your own CFD in there.
I went with route #3.
You must be a registered user to add a comment. If you've already registered, sign in. Otherwise, register and sign in.


You must be a registered user to add a comment. If you've already registered, sign in. Otherwise, register and sign in.