Community resources
Community resources
Community resources
- Community
- Q&A
- Jira Service Management
- Questions
- Reporting on Service Desk Metrics
Reporting on Service Desk Metrics

Hello everyone!
I would like to get more insight into the performance of my service desk, and getting a report of some metrics would be great. However, the built-in functionality seems unable to provide the information that I would like to see.
The marketplace has a lot of apps that might be useful but I am to unfamiliar with them to make an educated choice, perhaps you fine people can help me out.
I am looking to get insight into:
- Number of times an issue has been re-opened
- First contact resolution
- Re-assigning an issue to a colleague
That is in addition to the default option of
- Time to Resolution
- Number of issues resolved during a period
- SLA met / breached
How do you get those metric information? If you use an app, which one and how do you like it?
If you have created an app yourself, fee free to let me know! Added bonus points if you have a demo video available on the benefits.
Thanks in advance!
8 answers
Hello @Paul Wiggers
As an alternative , I guess you can try Time in Status for Jira Cloud (developed by my SaaSJet team) with 7 types of status time reports can help you with this.
Here are all of them:

This add-on has a 30-day free trial version.
Please, let me know if you have any questions
Best regards, Valeriia
As an alternative, you can try our app :
The add-on provides the time in each status for the entire lifecycle of the issue, based on the date range, assignees and multiple other filters, and various graphs too.
There are 20+ reports in the app which help to meet a wide range of use cases.
Also you can group your statuses to create your own resolution time.
Do try it out.
Disclaimer : I work for RVS, the vendor for this app

You must be a registered user to add a comment. If you've already registered, sign in. Otherwise, register and sign in.
Thank you all for your suggestions. I will take a look at all the offers and give them a try to see what will benefit us the most.
You must be a registered user to add a comment. If you've already registered, sign in. Otherwise, register and sign in.
You must be a registered user to add a comment. If you've already registered, sign in. Otherwise, register and sign in.
Hi @Paul Wiggers,
Have a look on this blog post An effective dashboard for Service Desk and Customer Support teams in Jira Service Management. Here you will find useful gadgets for tracking metrics you mentioned plus some others (like CSAT, for example).
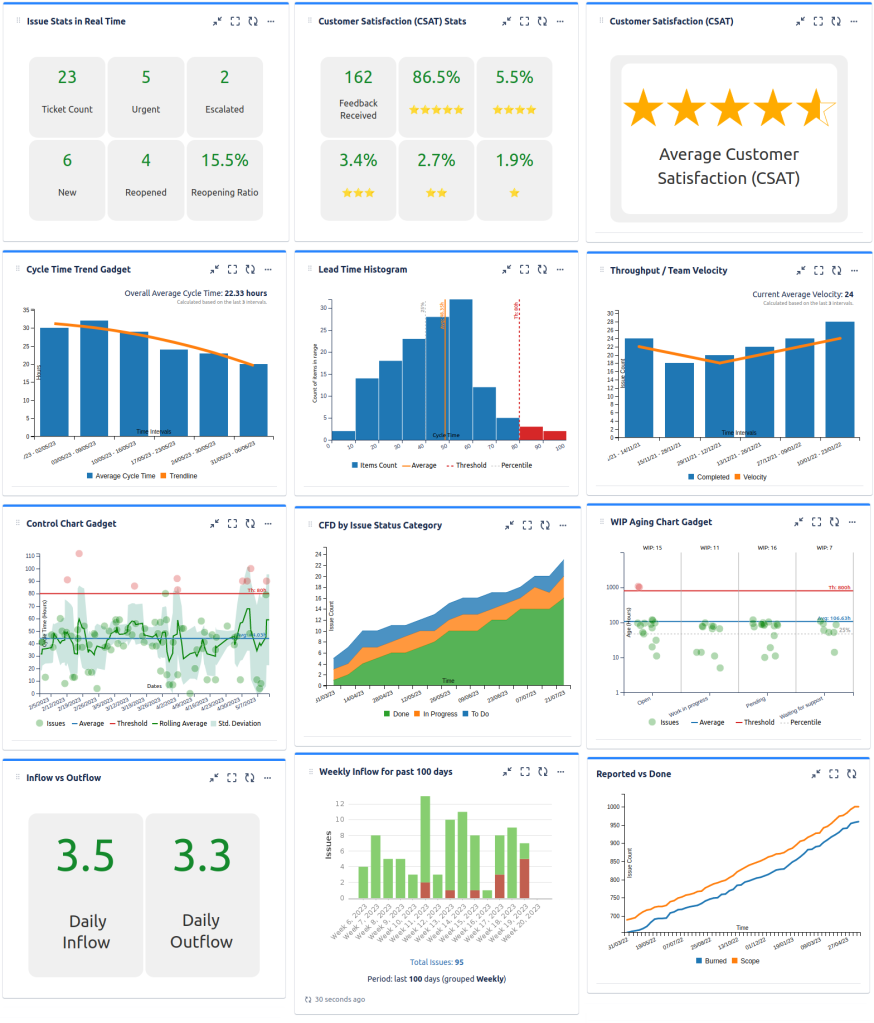
Most of these gadgets are from our Great Gadgets app. If you have questions, please feel free to contact us at support@stonikbyte.com.
Thank you,
Danut M.
You must be a registered user to add a comment. If you've already registered, sign in. Otherwise, register and sign in.
You can try Status Time Reports app developed by our team. It mainly provides reports and gadgets based on how much time passed in each status.
Here is the online demo link, you can see it in action and try without installing the app.
- Number of times an issue has been re-opened
You can have a look at Status Count And Entry Dates report. If status count of "Open" status is greater than 1, then this issue is re-opened. - First contact resolution
You can have a look at this solution. - Re-assigning an issue to a colleague
You can have a look at Time in Assignee report. This report shows how much time is spent on each assignee. If you enable “Show count“ in “Report type“ field, the report will also show how many times an issue is assigned to a user.
If you are looking for a completely free solution, you can try the limited version Status Time Free.
Hope it helps.
You must be a registered user to add a comment. If you've already registered, sign in. Otherwise, register and sign in.
Hello @Paul Wiggers
If you are OK with using a marketplace app for this, our team at OBSS built Timepiece - Time in Status for Jira for these needs. It is available for Jira Server, Cloud, and Data Center.
Time in Status mainly allows you to see how much time each issue spent on each status or each assignee.


You can combine the time for multiple statuses to get metrics like Issue Age, Cycle Time, Lead Time, Resolution Time etc.
You can also get Count reports that show how many times each status or each transition was used.


For all numeric report types, you can calculate averages and sums of those durations grouped by the issue fields you select. For example total in-progress time per Vertical or average resolution time per sprint, week, month, issuetype, request type, etc. The ability to group by parts of dates (year, month, week, day, hour) or sprints is particularly useful here since it allows you to compare different time periods or see the trend.

The app calculates its reports using already existing Jira issue histories so when you install the app, you don't need to add anything to your issue workflows and you can get reports on your past issues as well. It supports both Company Managed and Team Managed projects for Jira Cloud.
Time in Status reports can be accessed through its own reporting page, dashboard gadgets, and issue view screen tabs. All these options can provide both calculated data tables and charts.


Timepiece - Time in Status for Jira
EmreT
You must be a registered user to add a comment. If you've already registered, sign in. Otherwise, register and sign in.
Hello @Paul Wiggers - nice to meet you 👋🏻
If you’re open to use a third-party app I would like to recommend an intuitive and easy-to-use solution - Mindpro Insights - Charts, Reports & Filters for Jira & JSM
With this cloud app, you can build, customize and share beautiful cross-project dashboard reports in seconds using your Jira and Jira Service Management data.

Here is a quick demo: Link Video
This app has a 30-day free trial version with full support and onboarding assistance included.
If you want, we'd love to offer you a live demo where you can talk about your specific needs.
Hope it helps, Eduardo, from Mindpro team
You must be a registered user to add a comment. If you've already registered, sign in. Otherwise, register and sign in.

You must be a registered user to add a comment. If you've already registered, sign in. Otherwise, register and sign in.