Community resources
Community resources
Community resources


- Community
- Products
- Jira Service Management
- Questions
- Breached SLAs Producing 0.0% Results in Reports
Breached SLAs Producing 0.0% Results in Reports

Hey everyone,
A number of the SLA-related reports included with JIRA are producing odd series values when those series include days where only a single issue is present, and that issue has breached its SLA. The following three screenshots demonstrate the problem:


The confusing part about this, for me, is that breached issues seem to be taken into account correctly when calculating a daily average, if they're mixed in with issues that have met their SLA:

I've also included a zoomed-out snip of the summary table for the 30-day period, in case that's helpful:

...and one of an export that I averaged out in Excel, which gave me the values I'd expect to have seen, though I can't say that those are correct either:

The only tweaks that have been done to either series via JQL is to filter out certain accounts that are used for testing. Further, we're making use of both JIRA's built-in SLA tools and the SLA Time and Report plugin, and my only thoughts are that we've mis-configured something in one of them (or both) that we're not aware of, or there's an issue with JIRA that we need to try and work around
Cheers in advance for your input; I'll be keeping an eye out for responses!
2 answers

Welcome to the Atlassian Community!
This is the default behavior of SLA Reports: if you have a single ticket, and that ticket breached, for that specific day view it will show 0% as from 100% of the issues that were created, none of them met the SLA.
If this answer has resolved your issue or helped you in any way, kindly consider accepting it by clicking on the "Accept" button. This helps other community members find similar solutions more efficiently in the future.
Regards,
Eugenio
Hey Eugenio,
Cheers for the response, and sorry that mine was so delayed
So I understand that with regards to the daily results, that makes sense, but surely the top-line summary values should take the missed days into account, alongside the rest of the data for the 30-day period? I'd expect it to be a value less than 100%, and much higher than 0%
You must be a registered user to add a comment. If you've already registered, sign in. Otherwise, register and sign in.

Hi @Nathan Paddick,
Stop struggling with limited Jira reports. You deserve better.
Take a look over this articles from our blog on how to track essential metrics in JSM with our Great Gadgets plugin: An effective dashboard for Service Desk and Customer Support teams in Jira Service Management
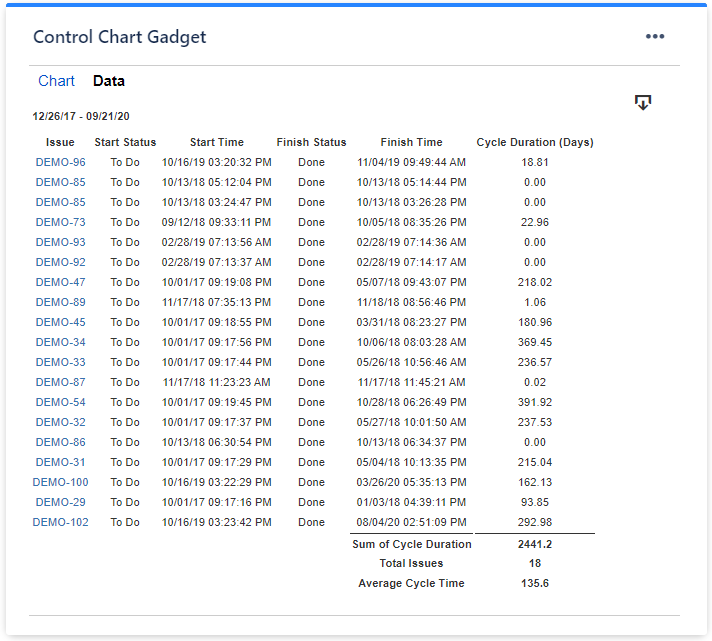
For tracking SLA I recommend using the Control Chart gadget. It displays the issues by their SLA (the cycle time calculated as time between two workflow statuses configured by you). For example, you can define SLA as time between issue creation and Done, or between statuses In Progress and Done.

You can also set a threshold that represents your SLA, to easily identify the issues that breached the SLA - the ones in red color.
The gadget offers also a detailed reports that you can export in CSV fur further processing.
With the Histogram Chart gadget you can see the SLA distribution and see how many issues broke the SLA.

With Cycle Time Trend gadget you can track the SLA or your team along the time and see the trend.

This app offers some other gadget that allows you to track not only SLA by many other metrics. It can be a great asset for your team/company.
I hope this helps. If you have any questions, please contact us at support@stonikbyte.com.
Danut
You must be a registered user to add a comment. If you've already registered, sign in. Otherwise, register and sign in.

Was this helpful?
Thanks!
DEPLOYMENT TYPE
CLOUDPRODUCT PLAN
STANDARDPERMISSIONS LEVEL
Site AdminAtlassian Community Events
- FAQ
- Community Guidelines
- About
- Privacy policy
- Notice at Collection
- Terms of use
- © 2024 Atlassian
You must be a registered user to add a comment. If you've already registered, sign in. Otherwise, register and sign in.