Community resources
Community resources
Community resources
- Community
- Products
- Jira Service Management
- Questions
- Average response time report
3 answers
Hi @Danielle David and to all who need to solve this case :)
You can easily do it with Assignee time report in Time in Status (developed by my SaaSJet team)
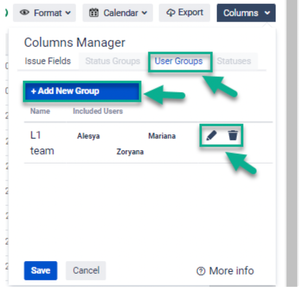
At the Assignee Time Report on the Column manager, you can manage the User Groups and compare them.
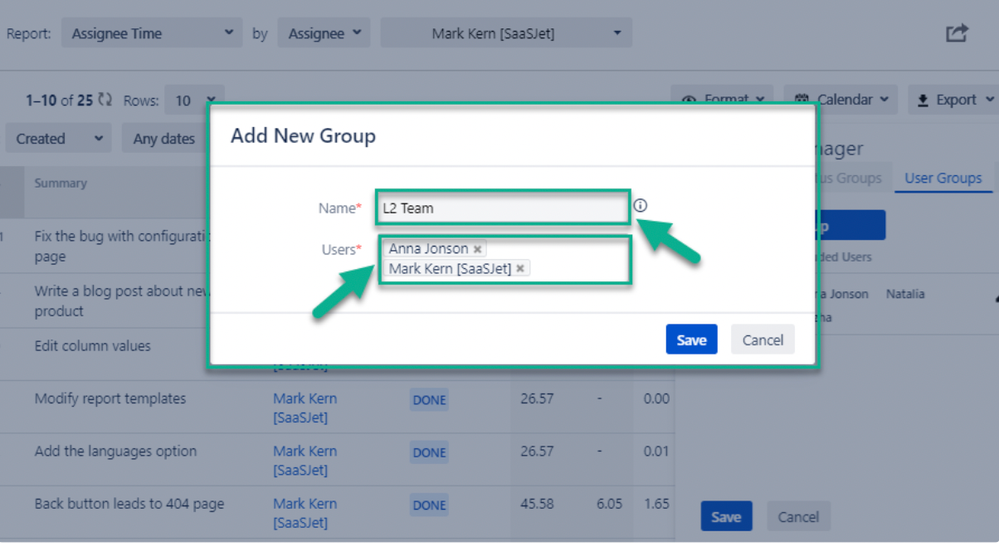
You can Add a New Group
When you add a new one, write down a name to your custom column and add necessary users to a group
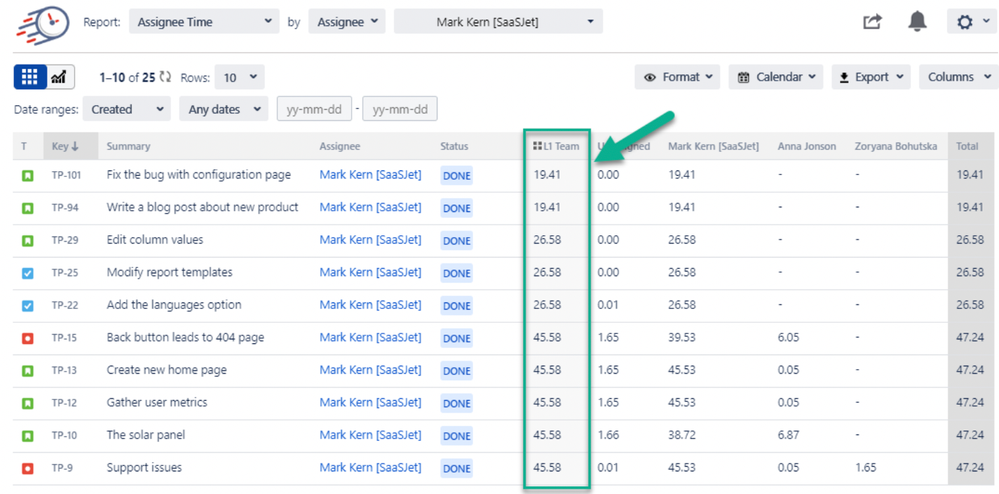
As a result, you'll get one column with summed data from your previously selected columns.
Here is documentation.
Add-on has a 30-day free trial version and free up to 10 users.
Hope it helps 😌
Valeriia

I, too, am looking for direction as to how to create the reports shown in the screenshots. I need to figure out the average response time for a client in 2023. I'm not certain how to do this and would benefit from the steps and specific JQL.
You must be a registered user to add a comment. If you've already registered, sign in. Otherwise, register and sign in.
Update on May 9th, 2024: Time in Status by OBSS was recently rebranded as Timepiece. It is still the same capable app with the same dedicated team behind it. The answer below mentions the app as "Time in Status" but you can find the app in the marketplace as "Timepiece (formerly Time in Status)".
Hello @Laurie Loftin ,
Welcome to the Atlassian Community!
I would like to introduce you to a very advanced tool with which you can easily access the reports you request. I can recommend Time in Status which is built by my team at OBSS. It is available for both Jira Cloud, and Data Center.
Time in Status mainly allows you to see how much time each issue spent on each status or each assignee. The app empowers you to effortlessly track metrics like Response Time, Issue Age, Cycle Time, Lead Time and Resolution Time directly within JIRA.
For all numeric report types, you can calculate averages and sums of those durations grouped by the issue fields you select. For example total in-progress time per customer or average response time per year, sprint, week, month, issuetype, request type, etc. The ability to group by parts of dates (year, month, week, day, hour) or sprints is particularly useful here since it allows you to compare different time periods or see the trend.
The app calculates its reports using already existing Jira issue histories so when you install the app, you don't need to add anything to your issue workflows and you can get reports on your past issues as well. It supports both Company Managed and Team Managed projects for Jira Cloud.
Time in Status reports can be accessed through its own reporting page, dashboard gadgets, and issue view screen tabs. All these options can provide both calculated data tables and charts.
Visit Time in Status to explore how our JIRA add-on can revolutionize your metrics measurement process. Enjoy a 30-day free trial to experience the full range of features.
Hope it helps,
Gizem
You must be a registered user to add a comment. If you've already registered, sign in. Otherwise, register and sign in.

Yes, as long as you have an SLA configured that measure it you can create a report for it. For example, I have a report that shows the average time to first response, both for the whole team and individual users.
You must be a registered user to add a comment. If you've already registered, sign in. Otherwise, register and sign in.
Thank you, can you please advise or show me the report
You must be a registered user to add a comment. If you've already registered, sign in. Otherwise, register and sign in.

Hello @Mikael Sandberg . I am an Jira user and manage a team of consultants dealing with defect resolution. An important KPI that I want to measure is 1. the response time from the moment the defect was assigned and 2. the resolution time ( delta between defact creation date and closure date) as average per consultant. How can i achieve this? Thank You, Catalin
You must be a registered user to add a comment. If you've already registered, sign in. Otherwise, register and sign in.

Hi @Catalin C_,
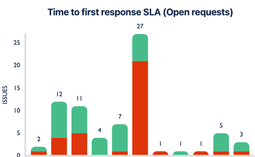
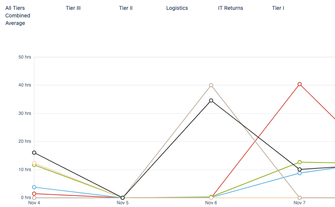
This should probably be it's own question, but yes, both of your KPIs that you want to measure are possible. You can either use the built-in Reports tool in JSM or use a dashboard gadget (I use and highly recommend Custom Charts for Jira) to create a chart similar to this:
You must be a registered user to add a comment. If you've already registered, sign in. Otherwise, register and sign in.

Sorry @Danielle David, I totally missed your reply, but the above screen shot shows how to do it in a dashboard gadget, and if you go to Reports you can create one there similar to this:
You must be a registered user to add a comment. If you've already registered, sign in. Otherwise, register and sign in.

Thank you @Mikael Sandberg I will play with it.
You must be a registered user to add a comment. If you've already registered, sign in. Otherwise, register and sign in.
Hey Mikael, your screen shots do not show how to do it, they show the result.
You must be a registered user to add a comment. If you've already registered, sign in. Otherwise, register and sign in.

Was this helpful?
Thanks!
Atlassian Community Events
- FAQ
- Community Guidelines
- About
- Privacy policy
- Notice at Collection
- Terms of use
- © 2025 Atlassian




You must be a registered user to add a comment. If you've already registered, sign in. Otherwise, register and sign in.