A pop-up survey could appear while you're here --curious what it's for? Click here to learn more!
×Community resources
Community resources
Community resources
cumulative flow - exact numbers for the start and the end of period

How can I get exact numbers for <number of issues> ax in cumulative flow diagram in the beginning and at the end of period. I want to calculate the amount of new tickets for a week, number of items finished during this week. Thank you!
2 answers
Hi @mitroann,
With our Great Gadgets app this can be done very easy.
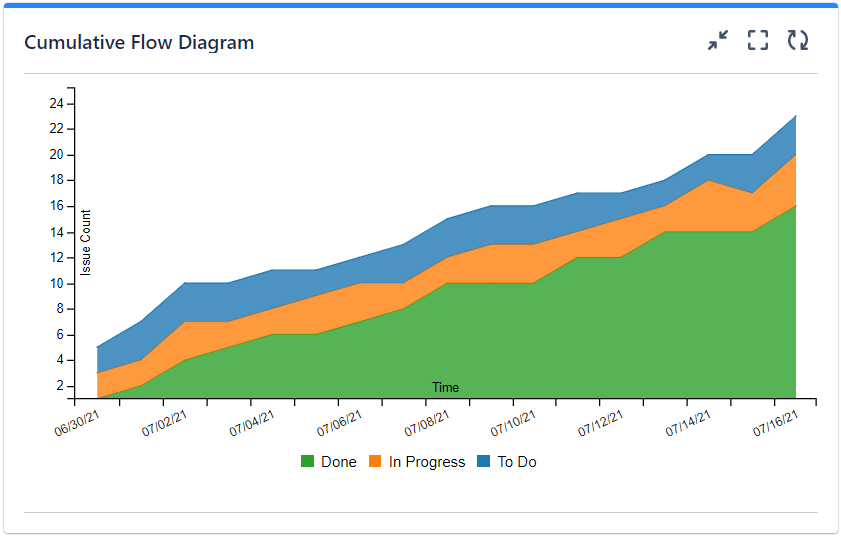
It offers a Cumulative Flow Diagram (CFD) gadget that allows visualizing the data at the beginning/end of each interval by hovering the mouse cursor over the time interval.
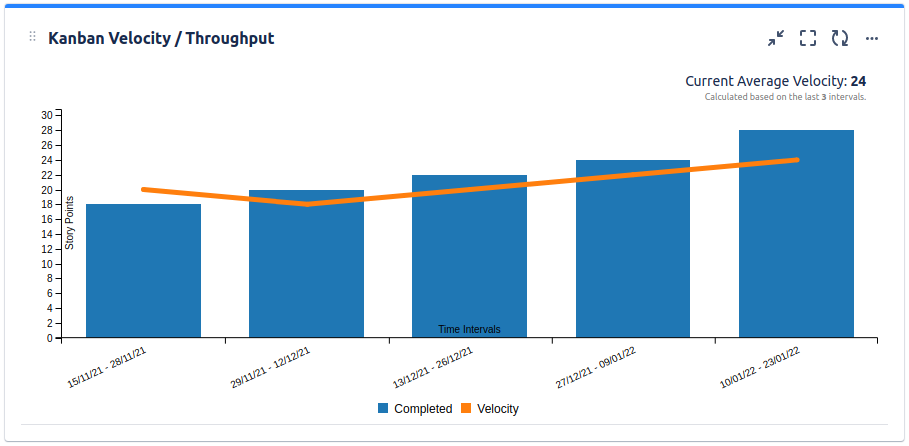
But, for measuring the tickets done in every week, it is better to use the Kanban Velocity gadget, which was designed to provide exactly this info. It supports calculation by issue count, story points, time estimates or any other of numerical field.
This app offers many other gadgets that you might find useful.
If you have questions, please don't hesitate to contact us at support@stonikbyte.com.
Thank you,
Danut M.

Navigate to the Cumulative Flow Diagram:
Go to your Jira project.
Click on the "Reports" tab in the project menu.
Select "Cumulative Flow Diagram" from the available reports.
Select the Desired Time Period:
On the Cumulative Flow Diagram page, select the time period for which you want to calculate the number of new tickets and finished items.
You can choose a specific week by adjusting the date range or use the predefined time intervals (e.g., Last 7 Days, Last 30 Days).
Analyze the Cumulative Flow Diagram:
The Cumulative Flow Diagram displays the flow of issues through different statuses over time.
Pay attention to the "New" and "Done" columns on the diagram.
Calculate the Number of New Tickets:
Look for the value in the "New" column at the beginning of your selected time period. This represents the number of new tickets at the start of the week.
Note down this value.
Calculate the Number of Finished Items:
Look for the value in the "Done" column at the end of your selected time period. This represents the number of items that were finished during the week.
Note down this value.
By comparing the number of new tickets at the start of the week with the number of finished items at the end of the week, you can calculate the amount of new tickets for the week and the number of items that were completed during that period.
You must be a registered user to add a comment. If you've already registered, sign in. Otherwise, register and sign in.

You must be a registered user to add a comment. If you've already registered, sign in. Otherwise, register and sign in.