Community resources
Community resources
Community resources
Start and End Date of each Status of a User Story

Hi,
I'm trying to find out a way in Jira to see Start & End Date of each Status of a User Story.
I understand History Tab in Activity has all the logs of status change with dates but what I'm looking is a consolidated view (may be in report or excel export) where I can see at a glance all the user stories of my Sprint with different status and dates.
Please guide if there is any way to achieve it.
Thanks!!
3 answers
1 accepted

Hi @Shahbaz Iqbal -- Welcome to the Atlassian Community!
There is nothing built-in which provides those transition date/time values in a tabular format as you described. The information is stored with the issue history for each item, and it is not easily accessible.
The built-in control chart report provides a way to view some of that information. Please look here to learn more about that: https://support.atlassian.com/jira-software-cloud/docs/view-and-understand-the-control-chart/
And that report definitely has limitations / problems. There are better marketplace addons for Jira to better show this information, either as stand-alone reports or as gadgets to add to the dashboards. I recommend searching for "Cycle Time" to learn about such options: https://marketplace.atlassian.com/search?hosting=cloud&product=jira&query=cycle%20time
You could also export the issue histories using the REST API into another tool for processing, although that can be a complicated process.
Kind regards,
Bill
I'm not sure what kind of report you would like to get, but I want to suggest a customizable solution from my team. With Issue History for Jira, you can see each date of change for status or any other issue field.
1. Choose the Sprint you need
2. Add the Status field to the columns
3. Sort by Issue key
Example:

You can try the app free for 30 days to find out if it works for you.
You must be a registered user to add a comment. If you've already registered, sign in. Otherwise, register and sign in.
Hi @Shahbaz Iqbal,
Try also the Control Chart offered by our Great Gadgets app.
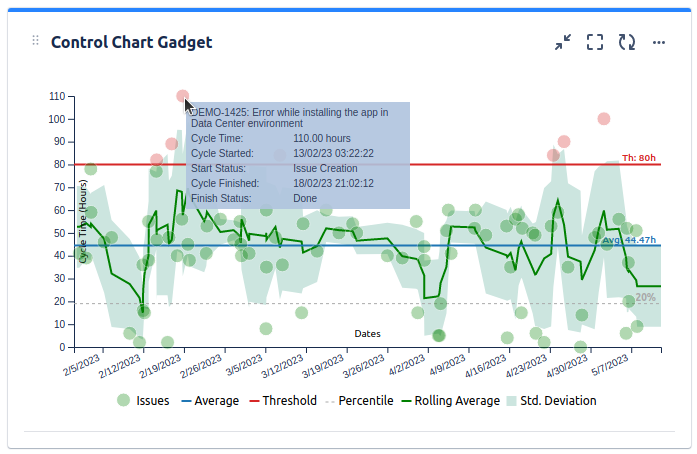
It is highly configurable and give you a Data tab with a nice report that you an easily export in CSV format.
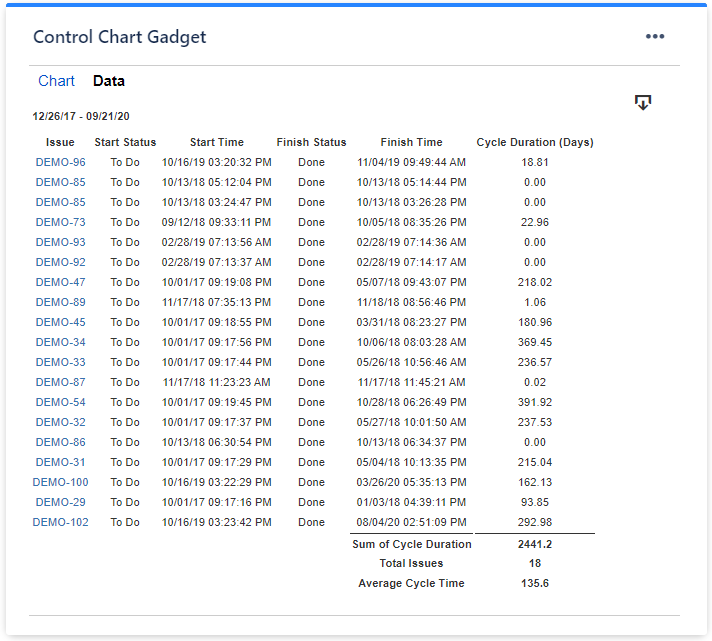
All you have to do is to create a filter that return the issues from the sprint, and to configure the gadget to use it. You can also use the Histogram chart instead.
This app offers many other gadgets that will make you tracking job easier and more effective. Just have a look over our blog to see how many things you can track with our app.
Thank you,
Danut Manda
You must be a registered user to add a comment. If you've already registered, sign in. Otherwise, register and sign in.

You must be a registered user to add a comment. If you've already registered, sign in. Otherwise, register and sign in.