Community resources
Community resources
Community resources
Sprint Reports
Hi Community.
I am going to analyze the Sprint on the following aspects:
1) How many tickets have been planned (the commitment) ?
2) How much time the team spent on the initially planned tickets ?
3) How many BUGS and urgent Enhancements have been added to Sprint after the sprint start ?
4) How much time the team spent on the added tickets ?
I could not filter out the tickets from point 3) using regular JQL. Tried to find anything useful in Marketplace for free :) but it was a useless work
Could you please help me to come up with a better approach on this report ? Any useful plugin for Jira Cloud that does the job ? Preferably FREE ones ;)
Thanks,
Arthur
3 answers
1 accepted
Hello @Arthur Harutyunyan
I don't believe there are any free apps that can provide what you want.
There are at least two not-free apps that provide a function to get a list of issues added to a sprint after it started.
You must be a registered user to add a comment. If you've already registered, sign in. Otherwise, register and sign in.
Hi @Arthur Harutyunyan ,
The app I have developed, Multi-team Scrum Metrics & Retrospective, can cover your requests:
1) How many tickets have been planned (the commitment) ?
2) How much time the team spent on the initially planned tickets ?

3) How many BUGS and urgent Enhancements have been added to Sprint after the sprint start ?
4) How much time the team spent on the added tickets ?

Other features:
- Tracking and Visualizing Any Team Metric (including using custom metrics created using JQL) for up to four team boards across sprints, months, quarters, half-years, or years
- Viewing and Drilling-Down Bars’ Content
- In-place Retrospecting of Bars’ Content
- Auto-generating reports with Pie Charts and Tables for Scrum, Kanban, XP, etc. - ability to compare teams and periods
- Auto-generating reports with Pie Charts and Tables for SoS, SAFe, LeSS, etc. - ability to compare periods or groups of teams, e.g., Team 1 and Team 5 as one entity versus Team 3 and Team 4 as another.
- Fine Tuning of Metrics - for example, ability to include issues of Removed Scope in the Uncompleted Scope.
- Overview (2 min): YouTube Video
- Demo in 4K (21 min): YouTube Video
It has a 30-day free trial period.
Best regards,
Alexey
You must be a registered user to add a comment. If you've already registered, sign in. Otherwise, register and sign in.
The Jira's sprint reports should give you this info, but it is true that not in the format you want.
Please take a look at the gadgets offered by our Great Gadgets app - it is payed add-on, but free if you have up to 10 users.
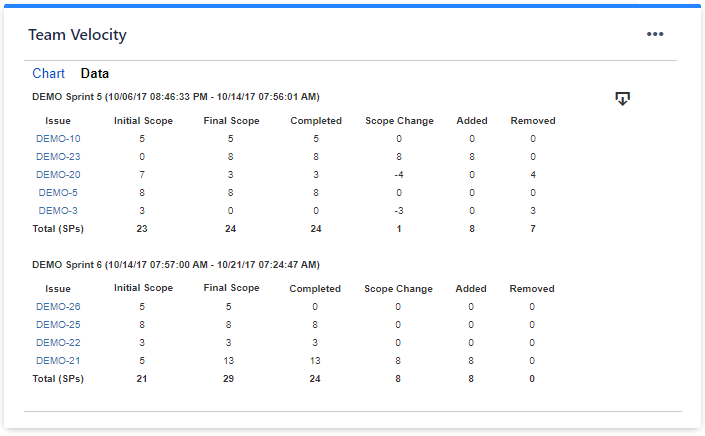
The Team Velocity Chart gadget offered by this app, can answer to most of your questions:
For #1) and #3) - you can find this info by configuring the gadget by Issue Count
Initial Scope indicates the commitment, Final Scope is the final scope (after scope changes) Added is the amount of issues added after sprint started.

For #2) and #4) - you can use the same gadget but configured by Time Remaining & Time Spent. This time, instead of number of issues, it will display the amount of time, in hours, for each category.
And if you want more detailed data, you could just export the contents of the gadget's Data tab and do additional processing in Excel.
The Sprint Burnup Burndown Chart offered by the same app can be also of great help for the cases that you mentioned, as it is displays more details about the issues from the sprint.
I hope this helps.
Danut.
Disclosure: I am part of the team who develops these gadgets.
You must be a registered user to add a comment. If you've already registered, sign in. Otherwise, register and sign in.

You must be a registered user to add a comment. If you've already registered, sign in. Otherwise, register and sign in.