Community resources
Community resources
Community resources
How to create a weekly sprint progress view in Jira ?

I want to create a weekly sprint progress view in Jira Dashboard but don't see any option to do it. I had tried adding a two dimensional statistic gadget but I don't see planned start date in the LOV for x-axis and y-axis. Can someone help me on this ?
5 answers
Hi @Agarwal, Akshit ,
You have multi-week sprints and you want to track sprints on a weekly basis? If so, I think you need to derive the tasks you need using certain criteria in a JQL filter. Such as
Sprint = "%YOUR_SPRINT%" AND resolutionDate >= %END_DATE_OF_YOUR_WEEK% resolutionDate <= %START_DATE_OF_YOUR_WEEK%
After that you can create several gadgets (2d statistic gadgets or Filter Results, for instance) per week.
The other option might be to use the app I developed - Multi-team Scrum Metrics & Retrospectives.
With it, you can do the same - apply your custom JQL filters, but you will get a more granular and analyzable view.
3 boards/teams in the same view, 1 period selected for analysis:


3 boards/teams in the same view, all periods are clicked for average metrics:


Best regards,
Alexey
Welcome to the community, @Agarwal, Akshit.
I’m Marlene, part of the team behind the Jira Cloud app Quick Filters for Jira Dashboards.
As others have mentioned, it’s not possible to use a date field as the x-axis in a 2D gadget. If you’re open to using an Atlassian Marketplace app, you could take a look at the Quick Time Series gadget in our app.
It lets you build weekly statistics based on date fields and offers additional configuration options.

You must be a registered user to add a comment. If you've already registered, sign in. Otherwise, register and sign in.
Hi @Agarwal, Akshit,
Welcome to the Atlassian Community!
You could also try the Sprint Burndown Chart and Sprint Health gadgets of Jira. They can be very helpful.
However, if you need more detailed insights or want to build a more effective Sprint Progress dashboard, you may need additional gadgets. In that case, you can search for and install an app (plugin) from the Atlassian Marketplace.
If you want to try an app, I would also recommend looking over our Great Gadgets app.
This app offers all you need for building an effective Scrum dashboard. Take a look over this article: https://community.atlassian.com/forums/App-Central-articles/8-gadgets-for-a-powerful-Scrum-dashboard-in-Jira/ba-p/1683063
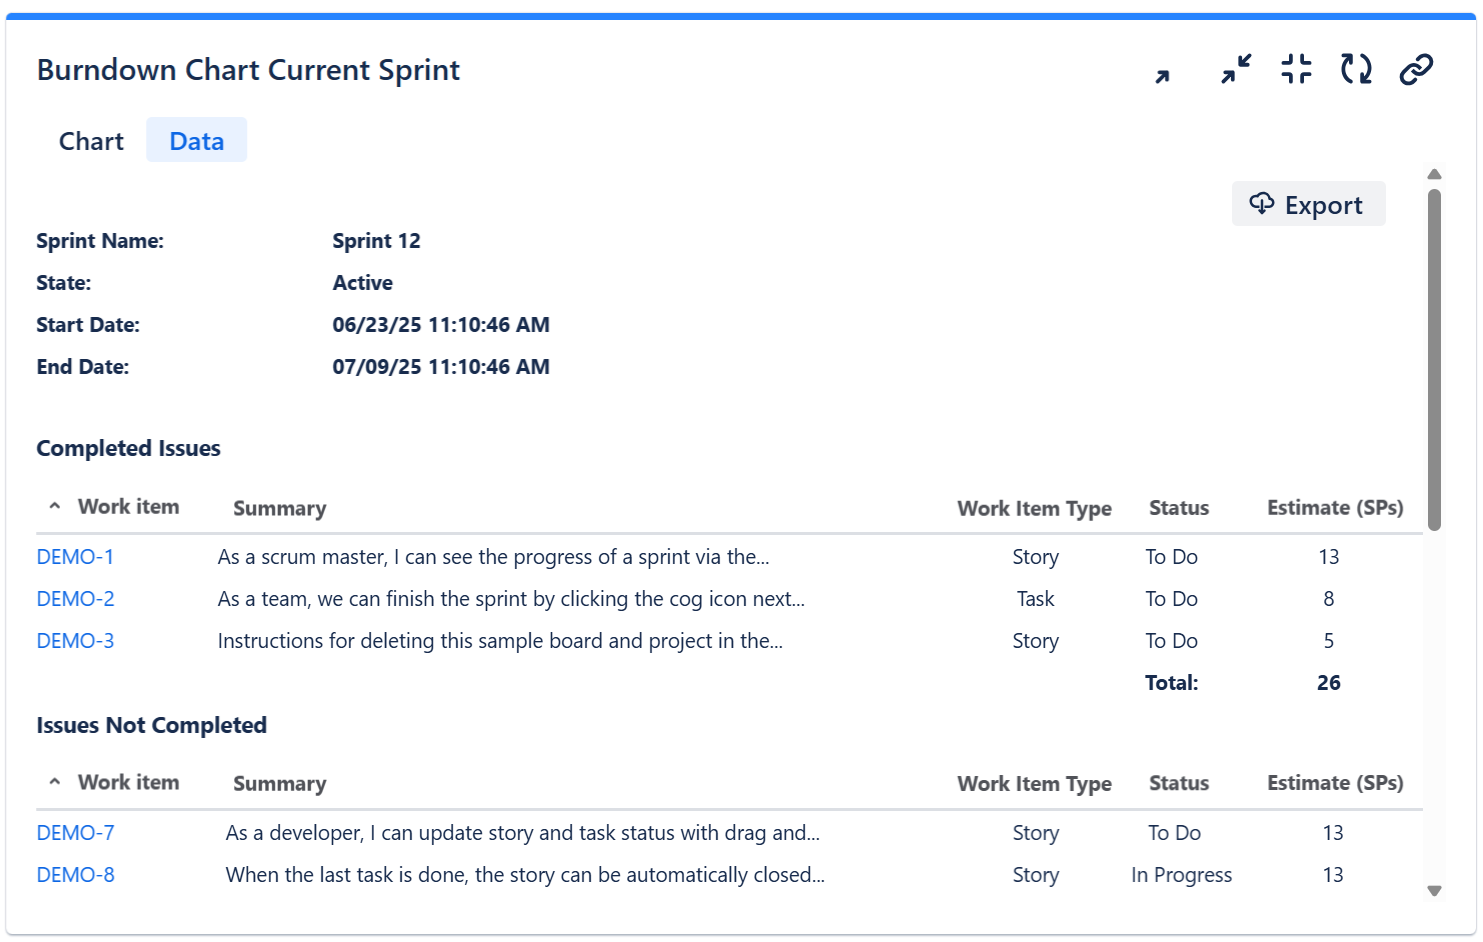
Specific for your case, I would recommend the Sprint Burndown Burnup Chart gadget. It can display the progress along the sprint, and offers a Sprint Report on its Data tab.

For displaying custom stats & numbers, your could look at the Pivot Table & Pivot Chart gadget, which is much more powerful than Jira's Advanced Issue Filter Statistics gadget.

If you need any help with the setup of these gadget, feel free to contact support@stonikbyte.com.
Danut.
You must be a registered user to add a comment. If you've already registered, sign in. Otherwise, register and sign in.
- Created vs Resolved gadget
- Filter Results gadget

“Create a weekly sprint progress dashboard showing issues grouped by Planned Start Date. Display progress per week with completed vs remaining work.”
You must be a registered user to add a comment. If you've already registered, sign in. Otherwise, register and sign in.
Describe what you want to see in your report. That would be helpful in trying to answer your question.
You must be a registered user to add a comment. If you've already registered, sign in. Otherwise, register and sign in.

You must be a registered user to add a comment. If you've already registered, sign in. Otherwise, register and sign in.