Community resources
Community resources
Community resources
Control Chart Isn't Showing Standard Deviation Shading (Unless Highlighted)

Hey team - having an issue when using our control chart. It will not show the shaded area for the Standard Deviation unless I highlight the chart. This makes it difficult for screenshots and reporting when you're missing your predictability.
Either I'm colour blind which someone here can confirm for me, or I have a setting on my browser that I'm missing. I've had other people view this and can't see it either.
Any help would be appreciated.

2 answers
Hi @Nick McCue,
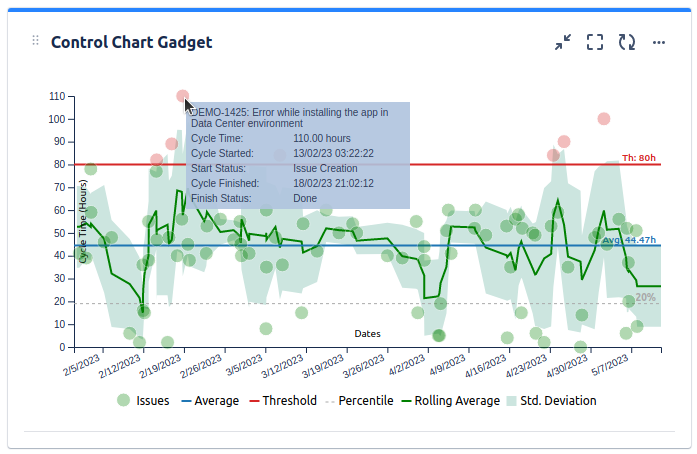
As an alternative, you could try our Great Gadgets app. One of the many gadgets that it offers is the Control Chart gadget that is highly configurable.
The app offers many other gadgets that you might find useful. To make a better idea, have a look on the articles from our blog.
If you have any questions, please don't hesitate to contact support@stonikbyte.com.
Thank you,
Danut M.

Hi @Nick McCue -- Welcome to the Atlassian Community!
Would you please post an image showing the symptom you describe, where the Atlassian interpretation of standard deviation is not displaying on the page?
Kind regards,
Bill
You must be a registered user to add a comment. If you've already registered, sign in. Otherwise, register and sign in.
Hi Bill - it's in the post :)
You must be a registered user to add a comment. If you've already registered, sign in. Otherwise, register and sign in.
The image I see in your post is showing the blue shaded area for the standard deviation, as described here: https://support.atlassian.com/jira-software-cloud/docs/view-and-understand-the-control-chart/
Do you have an image which shows the chart and which does not show the blue shaded area, as you described? Thanks!
You must be a registered user to add a comment. If you've already registered, sign in. Otherwise, register and sign in.

You must be a registered user to add a comment. If you've already registered, sign in. Otherwise, register and sign in.