Community resources
Community resources
Community resources
Advance Roadmap / Number of days Issue is on Kanban Board
Hello -
We use a Kanban board for support related issues. We created a Plan to reference.
Can we identify on the Plan when the issue was placed on the board or how many days in a particular column?
Thanks,
Jeff
6 answers
4 accepted

Hi @Jeff Murray
Not sure if this can be achieved through roadmaps. You can use Jira Rest APIs to pull this information or view issue changelog to get this data.
You can also try out a mktplace app if you prefer one. You can take a look at the one which we have built for the same use case.
One of the many reports which the app provides is Time in Status report which shows how much time each issue spent through each status. You can also group your statuses to check your issue resolution times The app has 20+ reports to track your bottleneck Issues & Processes.
Disclaimer : I work for the vendor who built this app

Hello @Jeff Murray ,
There is no built in solution in Jira for this. So in order to track the time spent on each column of your Kanban Board I suggest you use a marketplace app. Timepiece - Time in Status for Jira which is developed by my team at OBSS, has a report type that will meet your need. Our app is available for both Jira Cloud, and Data Center.
Time in Status mainly allows you to see how much time each issue spent on each status (in your use case on each column of the Kanban board) or each assignee.
Status Duration report (please see the screenshot above) which shows how much time each issue spent on each status. You can combine the time for multiple statuses to get metrics like Issue Age, Cycle Time, Lead Time, Resolution Time etc.

For all numeric report types, you can calculate averages and sums of those durations grouped by the issue fields you select. For example total in-progress time per customer or average resolution time per sprint, week, month, issuetype, request type, etc. The ability to group by parts of dates (year, month, week, day, hour) or sprints is particularly useful here since it allows you to compare different time periods or see the trend.

The app calculates its reports using already existing Jira issue histories so when you install the app, you don't need to add anything to your issue workflows and you can get reports on your past issues as well.
Time in Status reports can be accessed through its own reporting page, dashboard gadgets, and issue view screen tabs. All these options can provide both calculated data tables and charts. And the app has a REST API so you can get the reports from Jira UI or via REST. Also you can export the reports in to various formats easily.
Visit Timepiece - Time in Status for Jira to explore how our JIRA add-on can revolutionize your metrics measurement process. Enjoy a 30-day free trial to experience the full range of features.
If you wish, you can also schedule a live demo. We will provide a comprehensive overview of the application and address any inquiries you may have.
Hope it helps,
Gizem
You must be a registered user to add a comment. If you've already registered, sign in. Otherwise, register and sign in.
Hi @Jeff Murray,
The Kanban boards display the number of days in column. This is enabled by default, but apparently this info is only displayed for the issues that are in that column for more than 1 day. See https://support.atlassian.com/jira-software-cloud/docs/customize-cards/#Using-Days-in-column.

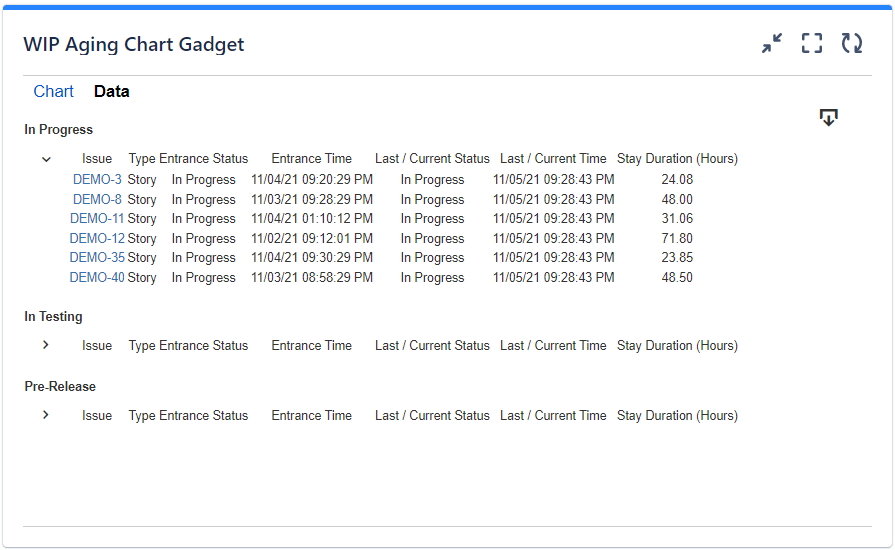
Another easy way to visualize the days in column, is to use the WIP Aging Chart gadget offered by our Great Gadgets app. It can display the issues from a kanban board along with their age. It is highly configurable, and allows you to set the age calculation method as "time in board column". You can also set a threshold to easily identify the issues that stay for too long (one ones in red color).

This gadget offers also a Data tab on which you can see the full list of issues with their age. This can be exported in CSV for further processing.
You can find more details about the Wip Aging Chart gadget (and the many others offered by the same app) in this article: https://community.atlassian.com/t5/Jira-Software-articles/Building-a-powerful-Kanban-dashboard-in-Jira-with-Great-Gadgets/ba-p/1664331
Hope this help.
Danut.
You must be a registered user to add a comment. If you've already registered, sign in. Otherwise, register and sign in.
Hi @Jeff Murray
It's Mary from Planyway for Jira: workload, roadmap, time tracking
In Jira, using a Kanban board for tracking support-related issues is a great way to visualize your team's work and workflow. Regarding your questions about tracking when an issue was placed on the board and how long it has been in a particular column, Jira offers several ways to track these metrics, though the exact method can depend on your Jira setup and whether you're using Jira Cloud or Jira Server/Data Center. Here are some general approaches:
-
Using Issue History: Each issue in Jira has an "Activity" tab that tracks all changes, including status changes which can tell you when an issue was moved to the board or into a specific column. This is a manual way to check but doesn't provide an at-a-glance view across multiple issues.
-
Adding Custom Fields: For tracking how long an issue has been in a particular column, you can create custom fields and use automation or scripts to update these fields based on the status change events. For example, you can have a custom field that captures the date when an issue is moved into a specific column and another field or script to calculate the days since that change.
-
Jira Dashboards: You can create dashboards in Jira to display various metrics, including how long issues have been in specific columns. By using gadgets like the "Filter Results" gadget, you can create JQL (Jira Query Language) queries to show issues based on their status and use the "Created" or "Updated" date fields to calculate durations. However, this might require some JQL knowledge and may not be as straightforward for tracking time in each column unless you have specific status changes that correspond to column changes.
-
Marketplace Apps: There are several apps available in the Atlassian Marketplace that extend Jira's functionality, including time in status or column tracking. Apps like "eazyBI Reports and Charts for Jira" and "Time in Status" can provide detailed reports on how long issues have been in each status (which you can map to your Kanban columns) or board.
-
Automation for Jira: If you're using Jira Cloud, Automation for Jira (also available for Server/Data Center as a separate plugin) allows you to create rules that can track and log when issues move to a specific column by updating a custom field or adding a comment. This way, you can automate the tracking of when an issue was placed on the board or moved to a particular column.
You must be a registered user to add a comment. If you've already registered, sign in. Otherwise, register and sign in.
Hi @Jeff Murray
If you prefer using a marketplace app, you can try Status Time Reports app developed by our team. It mainly provides reports and gadgets based on how much time passed in each status.
Here is the online demo link, you can see it in action and try without installing the app. For further details, you can have a look at Status Time Reports How to Videos.
- This app has a dynamic status grouping feature so that you can generate various valuable reports as time in status, time in assignee, status entry dates and status counts, cycle time and lead time, resolution time, average/sum reports by any field(e.g. average in progress time by project, average cycle time by issue creation month).
- You can search issues by Project, Issue Type, Status, Assignee, Issue Creation/Resolution Date(and any other Date field) and JQL Query.
- Status durations are calculated according to the working calendar you define. Once you enter your working calendar into the app, it takes your working schedule into account too. That is, "In Progress" time of an issue opened on Friday at 5 PM and closed on Monday at 9 AM, will be a few hours rather than 3 days.
- You can set different duration formats.
- You can export reports in CSV file format and open them in MS Excel.
- You can also add this app as a gadget to your Jira dashboards and reach “Status Time” from Issue Detail page.
- You can enable/disable access to Status Time reports&gadgets and Issue Detail page per project, users, groups or project role.
If you are looking for a completely free solution, you can try the limited version Status Time Reports Free.
Hope it helps.
You must be a registered user to add a comment. If you've already registered, sign in. Otherwise, register and sign in.
Thanks, Maria. I would like to track once it enters our SE board until it is moved to another board (project).
Regards,
Jeff
You must be a registered user to add a comment. If you've already registered, sign in. Otherwise, register and sign in.

You must be a registered user to add a comment. If you've already registered, sign in. Otherwise, register and sign in.