The Atlassian Community Forums are currently in read-only mode. We will be relaunching on a new platform on September 22 (read more here). We apologize for the extended downtime. For concerns or questions, please email communitymanagers@atlassian.com. See you on the other side, on the new Atlassian Community Forums! :)
×Community resources
Community resources
Community resources
- Community
- Q&A
- Jira Service Management
- Questions
- Custom chart for resolution time of each ticket
Custom chart for resolution time of each ticket

Is it possible to have a chart, where time is displayed on the Y-axis
And Jira closed tickets on the X axis; want to present the resolution time of the tickets.
Is there an option to have such a chart in the Dashboards?
or Reports section?
3 answers
Comments for this post are closed
Community moderators have prevented the ability to post new answers.

Hi @Achal Rajurkar,
You can try the Control Chart report of Jira.
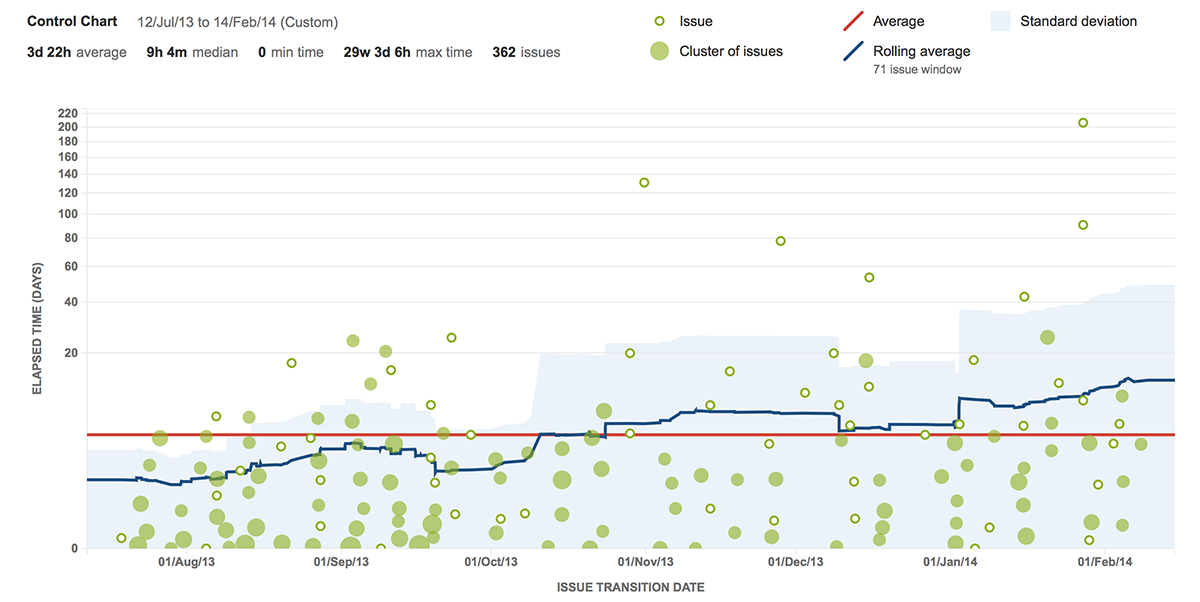
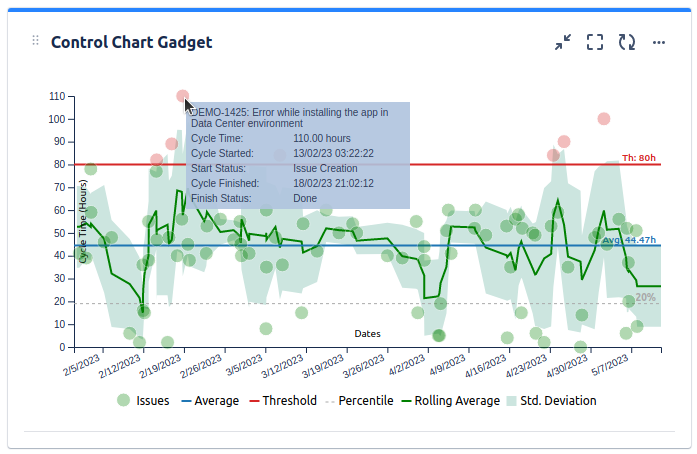
Or even better, the Control Chart Gadget offered by our Great Gadgets plugin, which is highly configurable and more powerful.
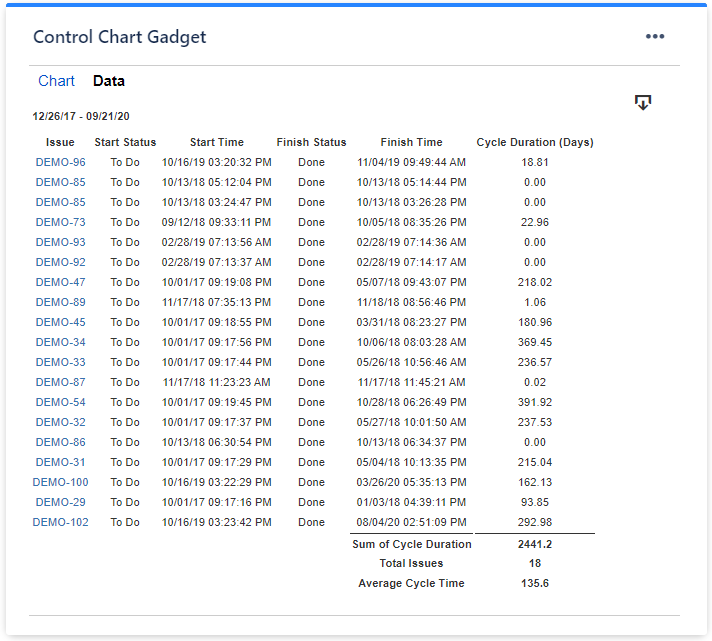
This gadget offers also a nice report that you can export in CSV.
This app offers many other gadgets that you will find useful. Have a look over this blog article to make an idea about how many things you can track in Jira Service Management: An effective dashboard for Service Desk and Customer Support teams in Jira Service Management.
Danut.

I'm not actually sure if this is possible in native Jira. What I'm actually sure of is that an app will greatly alleviate your visualization and reporting pains.
My company develops Dashboard Hub for Jira – Custom Charts & Share Reports a reporting app that allows you to create powerful and highly sharable custom charts in a fun and easy way – no dev skills needed!
In this live dashboard or in the screenshot below you can find the Time to Resolution gadget, which I think is what you need.

Why don't you try Dashboard Hub for 30 days for free? No compromises, no charges. Just 30 days to see if it helps you company :)
All the best,
Iván García, Appfire
You must be a registered user to add a comment. If you've already registered, sign in. Otherwise, register and sign in.

With our app Custom Charts for Jira, you can create customized reports directly on your Jira Dashboard (or your JSM portal) so I recommend trying it out.
There is a whole reporting section on the Atlassian Marketplace where you can browse different options:
You must be a registered user to add a comment. If you've already registered, sign in. Otherwise, register and sign in.
Comments for this post are closed
Community moderators have prevented the ability to post new answers.

You must be a registered user to add a comment. If you've already registered, sign in. Otherwise, register and sign in.