Community resources
Community resources
Community resources
Issue rating for Jira - matrix view?

I have issues with two dimensions (single select custom fields) for priority ratings and want my issue displayed in a grid according to the selection of each dimension in a single issue.
Drag'n'Drop in the matrix would be a must have feature as well as configurable choice of custom fields to be displayed for an issue in the grid.
I have already seen something similar in the risk register for BigPicture but actually needs something not focused on risks with more configuration options.
Does anyone an app that could be helpful?
Many thanks
Nadine
1 answer
Hi Nadine,
I'll apologize in advance for not totally understanding what you're looking to achieve - these types of questions are tricky when we're working over the internet and not looking at the same screen!
On the reporting side, eazyBI can be configured to show issues in nearly any type of chart or graph you can imagine. There is a drag and drop report editor. I think this is where you were headed with your question.
For editing issues and smaller reporting needs, I just did a search on the Marketplace for matrix views and came up with a few hits. Hopefully one of these is down the path you're looking if reporting wasn't exactly what you were searching for.
Cheers,
Daniel

Hello Daniel
Thanks a lot for your response.
I had already checked the marketplace myself and did not really find an option that fits my needs: I have two single select custom fields, f.ex. priority and return on investment with five options each (highest, hight, medium, low, lowest). That should turn into a 5x5 grid with priority on the x-axis and return on investment on the y-axis.
When I create an issue with priority medium and return on investment lowest, the issue should be displayed in the according box on the grid.
So, if anyone has any ideas, I'd be more than happy to hear them. Otherwise, I hope for SoftwarePlant to listen to my improvement requests for their BIgPicture Risk Module ;-)
Cheers
Nadine
You must be a registered user to add a comment. If you've already registered, sign in. Otherwise, register and sign in.

Hi Nadine,
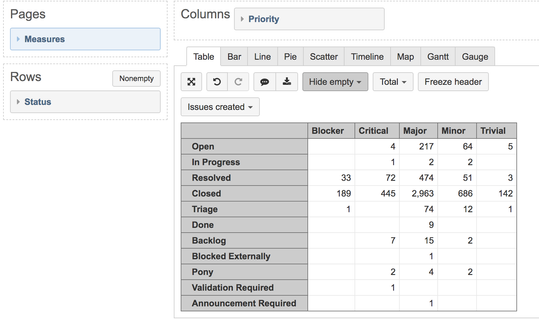
in eazyBI, you can get matrix view table: use one dimension in rows, another dimension in columns; plus, add a measure. Those dimensions could be based on custom fields as well.
Then, in the cross-sections of each row and column, would appear values depending on the selected measure: it could be issue count (if default measure "Issues created" is used), different values from those issues (logged hours, estimates, story points etc) as well as printed lists of issue keys (custom measure should be created for that).
The example below shows the number of issues; as mentioned, instead of the issue count, different information could be displayed in the cells.
If you have a very specific report in your mind that you want to implement using eazyBI, do not hesitate to ask support@eazybi.com.
Ilze, eazyBI Support Consultant
You must be a registered user to add a comment. If you've already registered, sign in. Otherwise, register and sign in.

Was this helpful?
Thanks!
TAGS
Community showcase
Atlassian Community Events
- FAQ
- Community Guidelines
- About
- Privacy policy
- Notice at Collection
- Terms of use
- © 2025 Atlassian


You must be a registered user to add a comment. If you've already registered, sign in. Otherwise, register and sign in.