Community resources
Community resources
Community resources
- Community
- Q&A
- Jira Service Management
- Questions
- dashboard creation
dashboard creation
I would like to create a dashboard in Jira where I can track SLAs. In this case, it would be a dashboard where I can check the time for unresolved demands in specific categories: over 7 days, from 7 to 14 days, and over 30 days. I would like these categories to be separated by subsectors, which in my case would be ERP, Infrastructure, and General. Could you help me with this?
1 answer
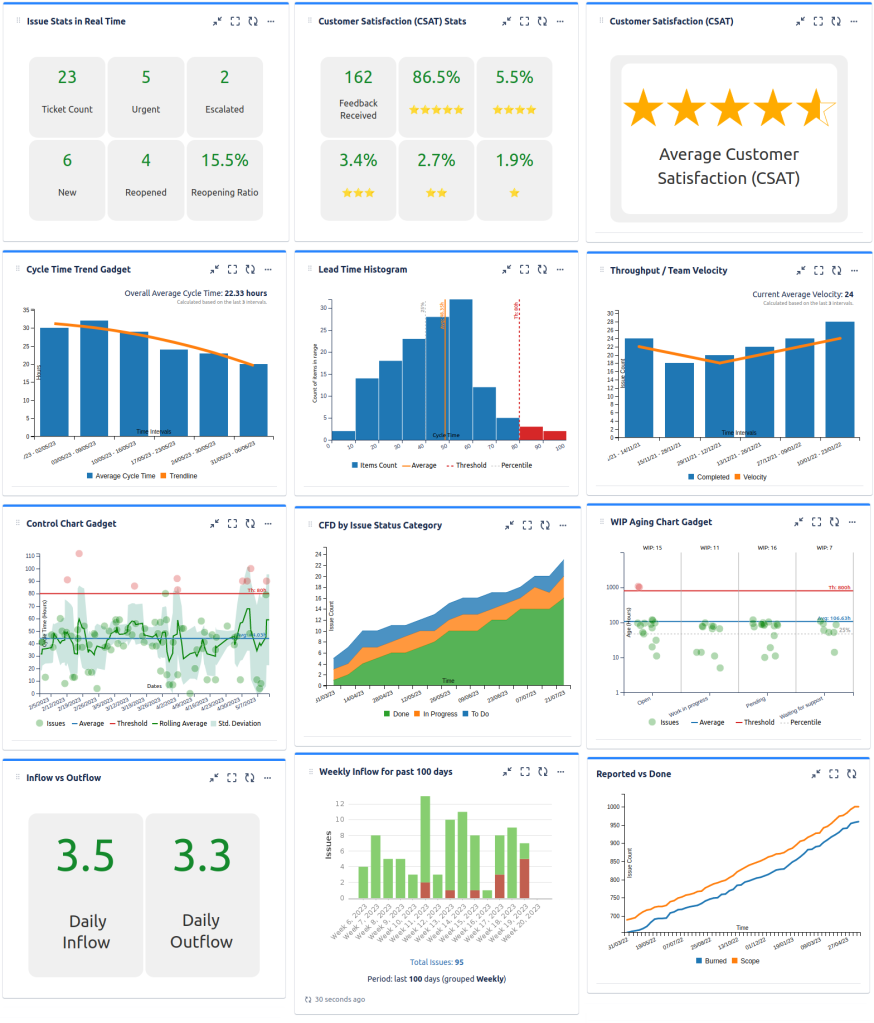
Try the WIP Aging Chart gadget offered by our Great Gadgets app.
This gadget displays issues in a board or filter based on their age. The age calculation method can be configured - in your case it will be calculated as the time since the issue was created.
On y axis is the age (in days), on x axis are the board columns or issue statuses showing the issues (dots) within them. WIP from the top indicates the total number of issues in that status/column.
The red line represents a threshold, which you should be set to your SLA. Above the red line, in red-color, are the issues that breached the SLA. Hovering or clicking an issue with show details about it.
You will need a gadget like this for each sub-sectors: ERP, Infrastructure, and General.
This app offers some other gadgets that allows measuring and visualizing the SLA as trend chart or as histogram chart. Also, with this app you can track many other metrics specific to JSM/ITSM.
Have a look over this article from our blog to make a better idea: An effective dashboard for Service Desk and Customer Support teams in Jira Service Management.

I hope this helps. If you have any questions, please don't hesitate to contact us at support@stonikbyte.com.
Danut.


You must be a registered user to add a comment. If you've already registered, sign in. Otherwise, register and sign in.