Community resources
Community resources
Community resources
- Community
- Q&A
- Jira Service Management
- Questions
- Report: created vs. resolved tickets per customer organization
Report: created vs. resolved tickets per customer organization
Hello everyone,
I am looking for a way to create a report in Jira Service Management, which shows all created vs. resolved tickets per customer organization we have. Ideally, this should also be made exportable as CSV file, with all fields and columns shown.
So for example:
Customer Organization A | Created tickets: 4 | Resolved tickets: 2
Customer Organization B | Created tickets: 2 | Resolved tickets: 1
...
Is there any way to do that? Or do you know any helpful apps from the Atlassian Marketplace which could help me with this?
Thank you in advance!
Best regards, Petra
4 answers
2 accepted
Hi @Petra Hasler,
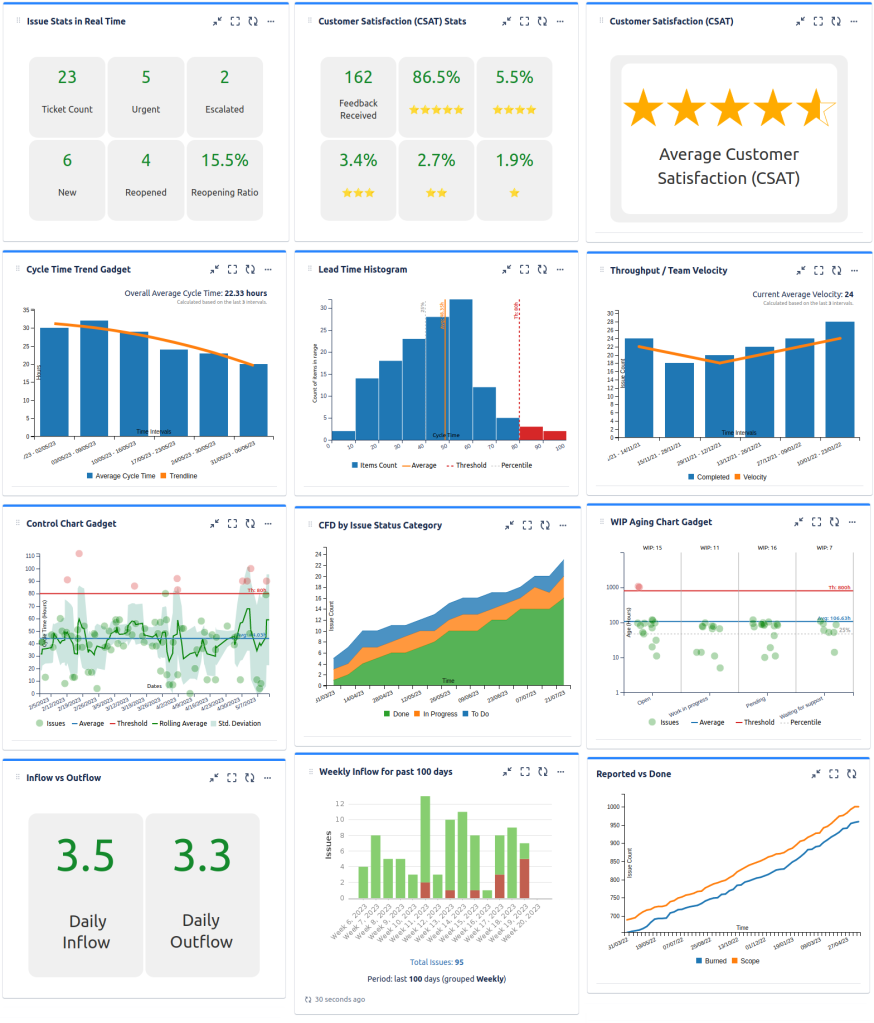
A more convenient option would be to use our Great Gadgets app.
This app offers many gadgets for building powerful dashboard in Jira Service Management. Take a look over this blog article to make a better idea:
An effective dashboard for Service Desk and Customer Support teams in Jira Service Management

More specifically, for addressing your need, you could use the Advanced Issue Filter Formula gadget, which allows applying from simple (COUNT, SUM, AVERAGE) to complex math formulas against the numerical fields of the issues from up to 6 filters.
With this gadget you can have something like this:
I hope this helps. If you have any questions, please contact us at support@stonikbyte.com.
Thank you,
Danut Manda

Would you be able to provide the setting you used to get the Advanced Filter Formula Results? I am trying to get a sum of the tickets created and the sum of the tickets resolved and a percentage. I am not sure what value to use under the "Field"
Thank you.
You must be a registered user to add a comment. If you've already registered, sign in. Otherwise, register and sign in.
Hi @Monica Ivanova,
In this case, you will have to use COUNT formula (instead of SUM), which returns the number of items from the specified filter. No field will be necessary in this case.
Variables
a = COUNT of "Filter all tickets"
b = COUNT of "Filter resolved tickets"
Displayed data:
a
b
b / a * 100
For further questions, please email support@stonikbyte.com and someone will get in touch with you right away.
Thank you,
Danut Manda
You must be a registered user to add a comment. If you've already registered, sign in. Otherwise, register and sign in.

Thank you very much @Danut M _StonikByte_
This is very helpful!
You must be a registered user to add a comment. If you've already registered, sign in. Otherwise, register and sign in.
Hope you are doing fine.
I would recommend checking Atlassian Analytics, which is a powerful Analytics tool that gives you the ability to create reports based on all data stored in Atlassian Datalake.
Atlassian Analytics offers different sets of charts, tables and is a powerful tool for you to create analytics reports. You can even perform SQL queries to get better results! This will also allow you to export data in CSV.
As an alternative solution, you can create reports using the default "Reports" functionality from JSM, but a bit of customization will be needed by using JQL. You will have to list each organization in a JQL by using "reporter in organizationMembers()" statement, by adding the organization name as a parameter on the function.
Hope this helps!
You must be a registered user to add a comment. If you've already registered, sign in. Otherwise, register and sign in.

I had a dream, and in that dream I went on the Atlassian community forum to find an answer to a question that someone else had, and the answer WASN'T buy an app!!
You must be a registered user to add a comment. If you've already registered, sign in. Otherwise, register and sign in.
Thank you @Danut M _StonikByte_ and @eugenio_onofre for your answers, I really appreciate your help and your insightful responses!
I think both could potentially be useful, however for my specific case I found another way of how to do it by simply filtering and exporting the results.
Thanks again and all the best,
Petra
You must be a registered user to add a comment. If you've already registered, sign in. Otherwise, register and sign in.


You must be a registered user to add a comment. If you've already registered, sign in. Otherwise, register and sign in.