Community resources
Community resources
- Community
- Products
- Jira Service Management
- Questions
- Average time to resolve tickets for last 30 days
Average time to resolve tickets for last 30 days

I'm searching for a method to track Average Time to resolve a ticket for the last 30 days. The built in widgets don't really provide a clear solution; I've read an article or two that indicate you can create a jql:
resolution != Unresolved AND Organizations = "ORGANISATION_NAME" and resolutiondate >= startOfMonth() and resolutiondate <= endOfMonth()
Is using JQL the best method to make this happen? It seems this would be a default gadget, but doesn't appear to be. The average age chart seems to only display open items, not the average resolve time.
Any easy methods to handle this?
7 answers

Hello @Brian Milovich
You can easily get the Average time it takes to solve each issue with Time in Status for Jira Cloud by my SaaSJet team. It generates the Average time report which you can filter by the assignee and get the average time it takes to solve the issues for the necessary assignee.

You can export this report to CSV and XLSX files or share the with other team members or even analytical systems for further analysis.
You can get a free 30-day trial version. And ask me if you have any additional questions.
Hope it helps
I'm looking to add an average time (from Open to Close) for the sum of all issues.
I'm hoping to have that number displayed within my dashboard. Is that possible?
You must be a registered user to add a comment. If you've already registered, sign in. Otherwise, register and sign in.
@Brian Milovich 👋
For everybody who searching the solution we have alternative - Time Between Statuses add-on which generates reports of the transition time from one status to another. With add-on you can easily have average time to resolution on the grid.
Or you can switch to histogram chart and get average time by average line.
Try it! Add-on has a 30-day free trial version, free up to 10 users and developed by SaaSJet as well.
Hope it helps 😌


You must be a registered user to add a comment. If you've already registered, sign in. Otherwise, register and sign in.
Wow, lots of marketplace solutions. Any Atlassian solutions?
You must be a registered user to add a comment. If you've already registered, sign in. Otherwise, register and sign in.
Hi @Shawn.Giese 👋
Unfortunately, Jira does not have a native field that calculates the Time to Resolution
that is why you see lots of marketplace solutions.
If you want get average time to resolve tickets, there are several Apps out there: Jira apps | Atlassian Marketplace
You must be a registered user to add a comment. If you've already registered, sign in. Otherwise, register and sign in.
Thanks Valeriia. I had seen the Atlassian Atlassian Average Time in Status Gadget that just required the Time in Status field to be added. I think that is available for free but I am not sure it would cover this use case.
https://confluence.atlassian.com/jirakb/how-to-setup-average-time-in-status-gadget-774244431.html
You must be a registered user to add a comment. If you've already registered, sign in. Otherwise, register and sign in.
This chart is available for free but it is really hard to get insights from there. Instead of that i can advise you to try Time in Status created by my SaaSJet team.
You will find there Average report, Time in Status Average Dashboards etc.
Here are Time in Status Average Dashboards for my 2 projects

You must be a registered user to add a comment. If you've already registered, sign in. Otherwise, register and sign in.
Yes, that does look very nice... but we just have too many users that would have to get licensed for a single use case. Does look nice though!
You must be a registered user to add a comment. If you've already registered, sign in. Otherwise, register and sign in.
Welcome to the community !!
If you are open for a mktplace solution, you can try out our plugin,
The add-on provides the time in each status for the entire lifecycle of the issue, including the average time.
You can group multiple statuses and only include the ones you need to define a total combined time in those statuses.
Do try it out.
Disclaimer : I work for RVS, the vendor for this app

You must be a registered user to add a comment. If you've already registered, sign in. Otherwise, register and sign in.
Hello @Brian Milovich ,
JQL is used to just filter issues. JQL by itself can't calculate average vales for you.
If you are limited to out-of-the-box functions, your best bet would be to use the Average Age chart (available as a dashboard gadget or project report) or the Control Chart (available as part of Kanban Board reports if you have Jira Software). Both of these options provide an overall picture of your issues and they offer limited flexibility in terms of report parameters.
For maximum flexibility, you should use a marketplace app.
If you are OK with using a marketplace app for this, our team at OBSS built Timepiece - Time in Status for Jira for this exact need. It is available for Jira Server, Cloud, and Data Center.
Time in Status mainly allows you to see how much time each issue spent on each status and on each assignee.


The app has Consolidated Columns feature. This feature allows you to combine the duration for multiple statuses into a single column and exclude unwanted ones. It is the most flexible way to get any measurement you might want. Measurements like Issue Age, Cycle Time, Lead Time, Resolution Time etc.
For all numeric report types, you can calculate averages and sums of those durations grouped by the issue fields you select. For example total in-progress time per customer (organization) or average resolution time per sprint, week, month, issuetype, request type, etc. The ability to group by parts of dates (year, month, week, day, hour) or sprints is particularly useful here since it allows you to compare different time periods or see the trend.

The app calculates its reports using already existing Jira issue histories so when you install the app, you don't need to add anything to your issue workflows and you can get reports on your past issues as well. It supports both Company Managed and Team Managed projects.
Time in Status reports can be accessed through its own reporting page, dashboard gadgets, and issue view screen tabs. All these options can provide both calculated data tables and charts.
And the app has a REST API so you can get the reports from Jira UI or via REST.


Using Time in Status you can:
- See how much time each issue spent on each status, assignee, user group and also see dates of status transitions.
- Calculate averages and sums of those durations grouped by issue fields you select. (For example, see average InProgress time per project and per issue type.)
- Export your data as XLS, XLSX, or CSV.
- Access data via REST API. (for integrations)
- Visualize data with various chart types.
- See Time in Status reports on Jira Dashboard gadgets
Timepiece - Time in Status for Jira
EmreT
You must be a registered user to add a comment. If you've already registered, sign in. Otherwise, register and sign in.
Hi @Shawn.Giese ,
If you are looking for a completely free solution, you can try the limited version Status Time Free. If only a few people will use it, it is less likely to hit the limits.
If you have any questions, feel free to schedule a call with us.
You must be a registered user to add a comment. If you've already registered, sign in. Otherwise, register and sign in.
Hi @Brian Milovich,
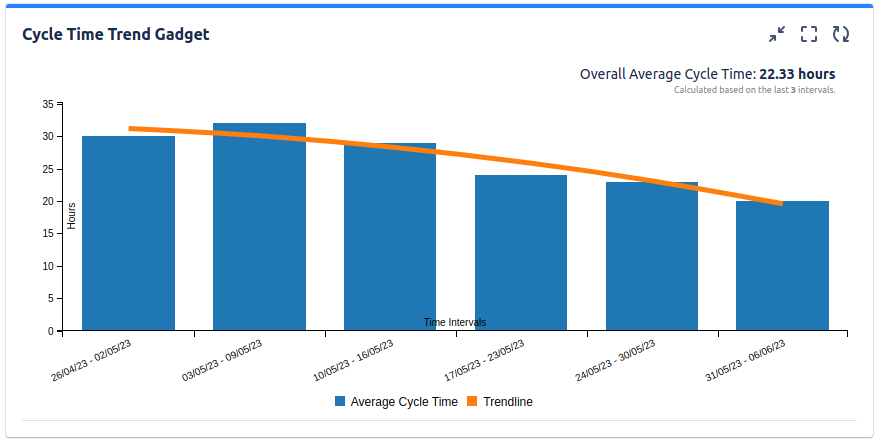
You could try our Great Gadgets app for Jira & Confluence.
It offers gadgets that allows calculating and displaying the average time of resolved tickets in very easy way.
The control chart displays the average of the resolved issues.
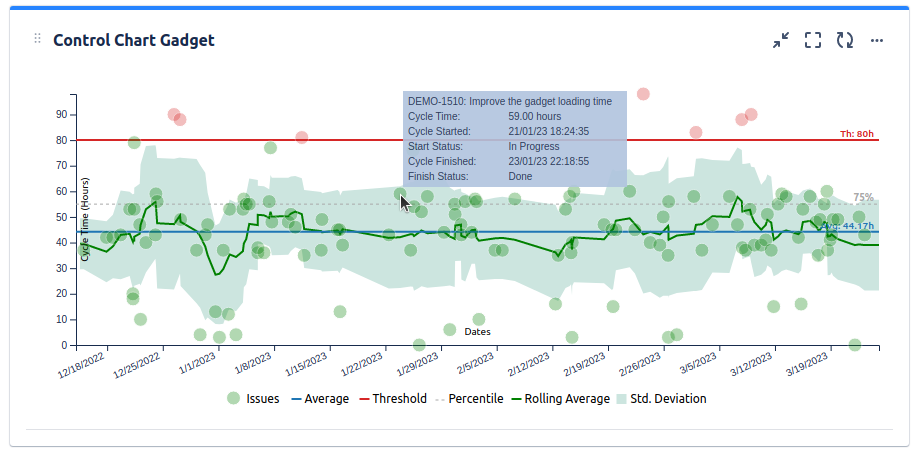
Also, the cycle time trend chart can display the average for time periods, as well as the trend.
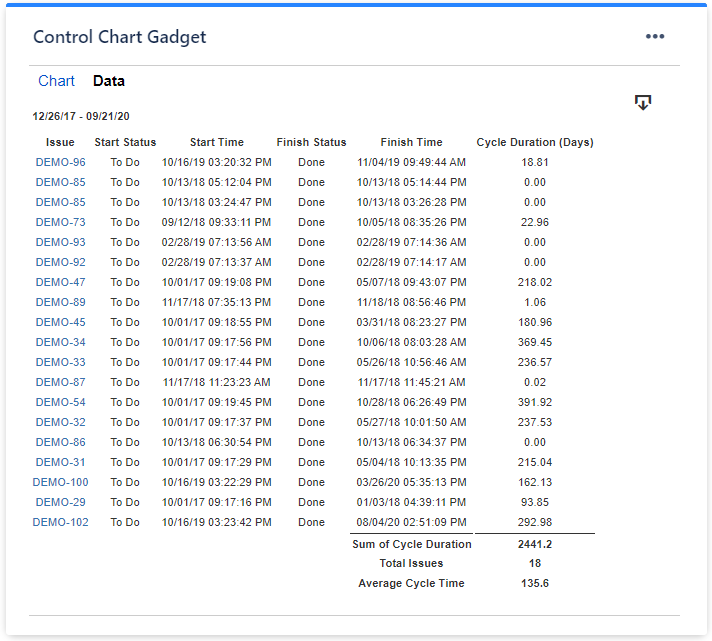
These gadgets offer also a Data tab, with details for every issue.
If you need help with the configuration, please contact support@stonikbyte.com.
Regards,
Danut
You must be a registered user to add a comment. If you've already registered, sign in. Otherwise, register and sign in.
Welcome to Atlassian Community!
As an alternative, you can try Status Time Reports app developed by our team. It mainly provides reports and gadgets based on how much time passed in each status.
Here is the online demo link, you can see it in action and try without installing the app.
- This app has a dynamic status grouping feature so that you can generate various valuable reports as time in status, time in assignee, status entry dates and status counts, cycle time and lead time, average/sum reports by any field(e.g. average in progress time by project, average cycle time by issue creation month).
- You can search issues by Project, Issue Type, Status, Assignee, Issue Creation/Resolution Date(and any other Date field) and JQL Query.
- Status durations are calculated according to the working calendar you define. Once you enter your working calendar into the app, it takes your working schedule into account too. That is, "In Progress" time of an issue opened on Friday at 5 PM and closed on Monday at 9 AM, will be a few hours rather than 3 days.
- You can set different duration formats.
- You can export reports in CSV file format and open them in MS Excel.
- You can also add this app as a gadget to your Jira dashboards and reach “Status Time” from Issue Detail page.
- You can enable/disable access to Status Time reports&gadgets and Issue Detail page per project, users, groups or project role.
If you are looking for a free solution, you can try the limited version Status Time Free.
Hope it helps.
You must be a registered user to add a comment. If you've already registered, sign in. Otherwise, register and sign in.

You must be a registered user to add a comment. If you've already registered, sign in. Otherwise, register and sign in.