Community resources
Community resources
Community resources
- Community
- Q&A
- Jira Service Management
- Questions
- Create a report by custom field: Service Area
Create a report by custom field: Service Area

I would like to create a report that shows how many open tickets there are for each Service Area. I've created a custom field for Service Area and assigned a drop down list with each of the 5 Service Area options.
When I try to create a new report, The "Series" option does not allow me to select my custom field of Service Area. They are all predefined Series.
I tried to paste a screenshot here, but it won't let me.
I also tried to create a Dashboard gadget, but none of the gadgets (pie chart, etc) allow me to pick a custom field.
I think this should be a simple report, but I am struggling.
3 answers

Hi @Carrie Blum
Nauris from eazyBI here.
You can import the "Service Area" field as a dimension in eazyBI and use it together with the predefined Open issues measure.
Here's how a chart like this would look. You can also click on each section to "Drill through Issue" to see the issues behind the numbers and open them in Jira.

eazyBI for Jira is a reporting app that you can find in Atlassian Marketplace
or in Jira Apps -> Explore more apps section.
Let me know if you need help setting this up!
Best regards,
Nauris / eazyBI support
Welcome to the community, @Carrie Blum,
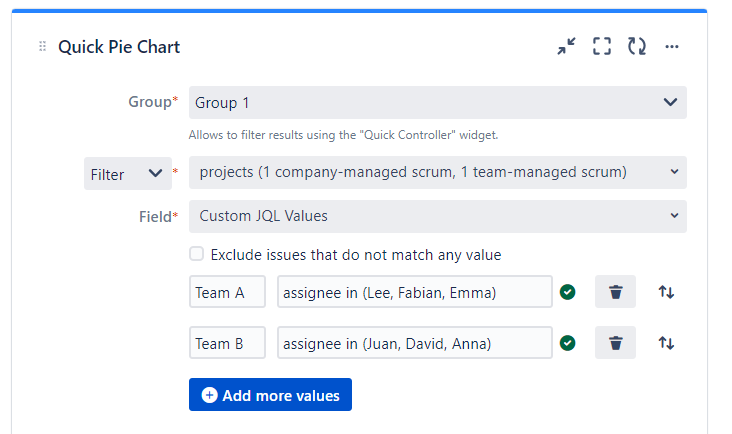
I am Marlene, the product manager of Quick Filters for Jira Dashboards.
If it's not possible to create a Pie Chart as suggested by @Danut M _StonikByte_, you could also check out our app.
We offer an option to work with "Custom JQL Filters" in the Quick Pie Chart gadget and other Quick Gadgets.
You simply would have define several JQL for the results you would like to see and add them to the configuration of the gadget.
You must be a registered user to add a comment. If you've already registered, sign in. Otherwise, register and sign in.
Hi @Carrie Blum,
Welcome to the Atlassian Community.
Not sure why that field is not available. On my test system I can see the newly added custom fields (Single Choice or Multiple Choices) available for use in the Jira's Pie Chart gadget. Also, the custom fields added in the context of the team-managed projects are available in the Pie Chart gadget.


How was this field added, in a team-managed project or globally under Jira Configuration > Issues > Fields > Custom fields? Please double check.
In case you don't make it work with Jira's gadgets or reports, and if using a plugin from Atlassian Marketplace is an option that you take into consideration, you could try the Pivot Table & Pivot Chart gadget offered by our Great Gadgets app, which should offer your field for use. This gadget lets you create all kind of statistics based on multiple fields in form of tables, heatmap tables, and charts of various types.


Danut.
You must be a registered user to add a comment. If you've already registered, sign in. Otherwise, register and sign in.

You must be a registered user to add a comment. If you've already registered, sign in. Otherwise, register and sign in.