Community resources
Community resources
Community resources
- Community
- Q&A
- Jira Service Management
- Questions
- Create a custom report similar to the default satisfaction report
Create a custom report similar to the default satisfaction report

I'm wanting to create a report in the same format as the default Satisfaction report with the comments, star rating and which agent resolved the ticket but we seem to only have the option create a custom report with the average of ratings as a line graph.
Needing to do this as within our project, we have multiple teams and we're wanting to pull more accurate and clear data per team/agent.
Is it possible to create a report similar to this?

2 answers
welcome to the community! I'm not too familiar with JSM built-in reports, so perhaps someone else can lean in here.
This being said, if you're open to solutions from the Atlassian Marketplace, you may want to have a look at the app that my team and I are working on, JXL for Jira.
JXL is a full-fledged spreadsheet/table view for your issues that allows viewing, inline-editing, sorting, and filtering by all your issue fields, much like you’d do in e.g. Excel or Google Sheets. It also comes with a range of so-called "smart columns" that aren’t natively available, including the satisfaction rating and the satisfaction comments, among many others.
This is how it looks in action:

As you can see above, you can easily sort and filter by the satisfaction columns, and also use them across JXL's many advanced features, such as support for (configurable) issue hierarchies, issue grouping by any issue field(s), sum-ups, or conditional formatting.
Once you've set up your report, you can work on your issues directly in JXL, trigger various operations in Jira, or export to e.g. Excel with just one click.
Any questions just let me know,
Best,
Hannes
Hi @isaiah.griffin,
A custom report might not be possible, but you could try to create a dashboard in Jira or a page in Confluence with the information you need by using a combination of gadgets from Jira and from our Great Gadgets app.
One of the many gadgets that Great Gadgets offer is the Issue Filter Formula gadget that allows you to display the average Satisfaction score for the issues in a filter. So if you have a filter for each team, you will be able to display the score for each team on a 5-star scale or as a number, as in this example. Clicking the value in the gadget will open the filter behind showing the issues.

With Advanced Issue Filter Formula gadget you can display up to 6 numbers, like this:

Also, with the Filter Results gadget of Jira you can display the issues with their score.

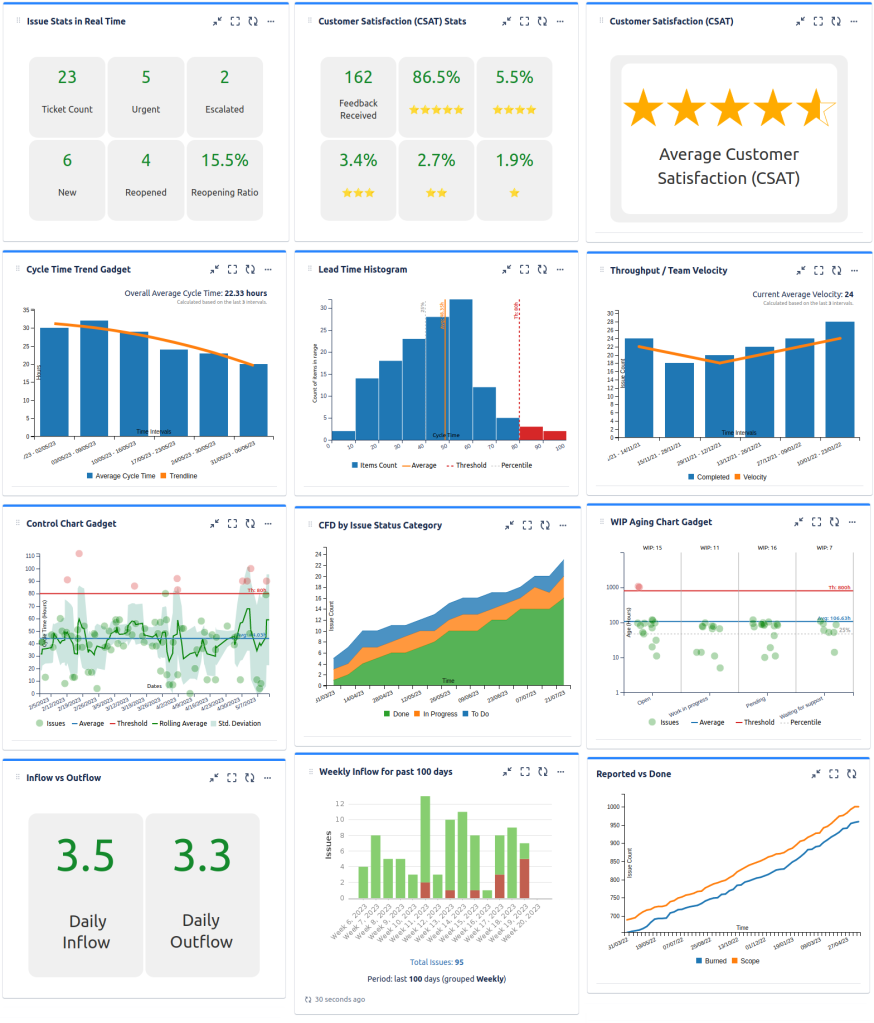
Please note that Great Gadgets app offers many other gadgets that allow you to build powerful dashboards for tracking service desk teams in JSM. See this article on our blog: An effective dashboard for Service Desk and Customer Support teams in Jira Service Management. Your full report could include gadgets like these:
If you need any help, please don't hesitate to contact us at support@stonikbyte.com.
Thank you,
Danut Manda
You must be a registered user to add a comment. If you've already registered, sign in. Otherwise, register and sign in.

You must be a registered user to add a comment. If you've already registered, sign in. Otherwise, register and sign in.