Community resources
Community resources
Community resources
- Community
- Q&A
- Statuspage
- Questions
- Can you add System Metric for your Atlassian Stack on Statuspage?
Can you add System Metric for your Atlassian Stack on Statuspage?

We have currently setup several components on our statuspage, mainly focusing on our Atlassian stack: Jira, JSM, Confluence & Opsgenie.
Is there a way to also add system metric for these components?
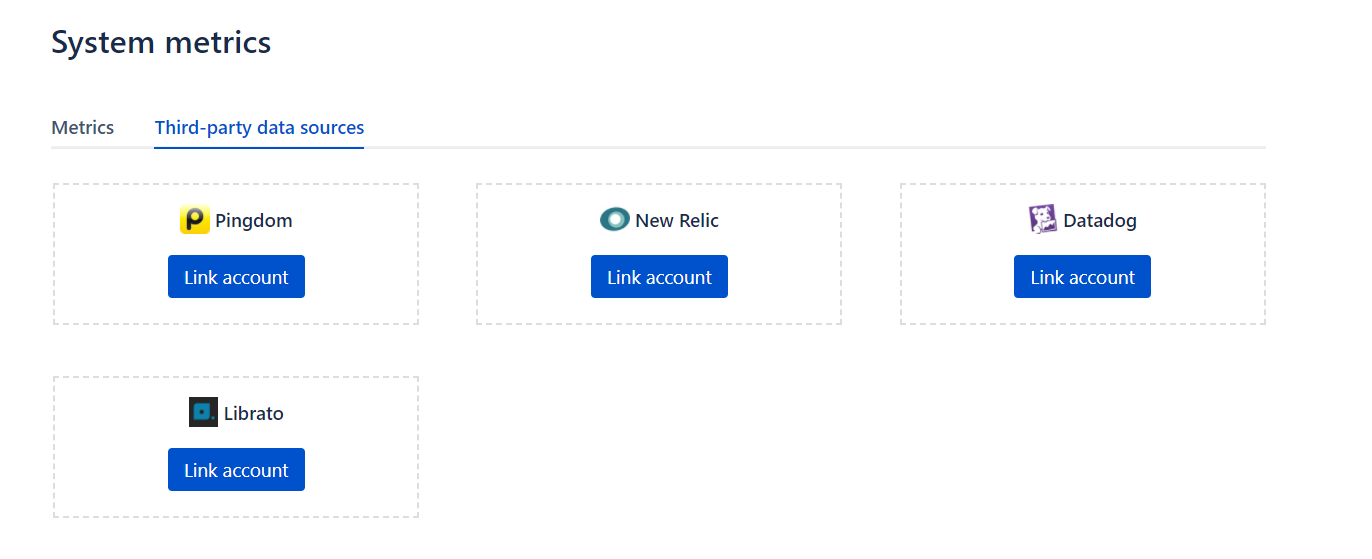
I currently only have the option to add the following 3rd parties:
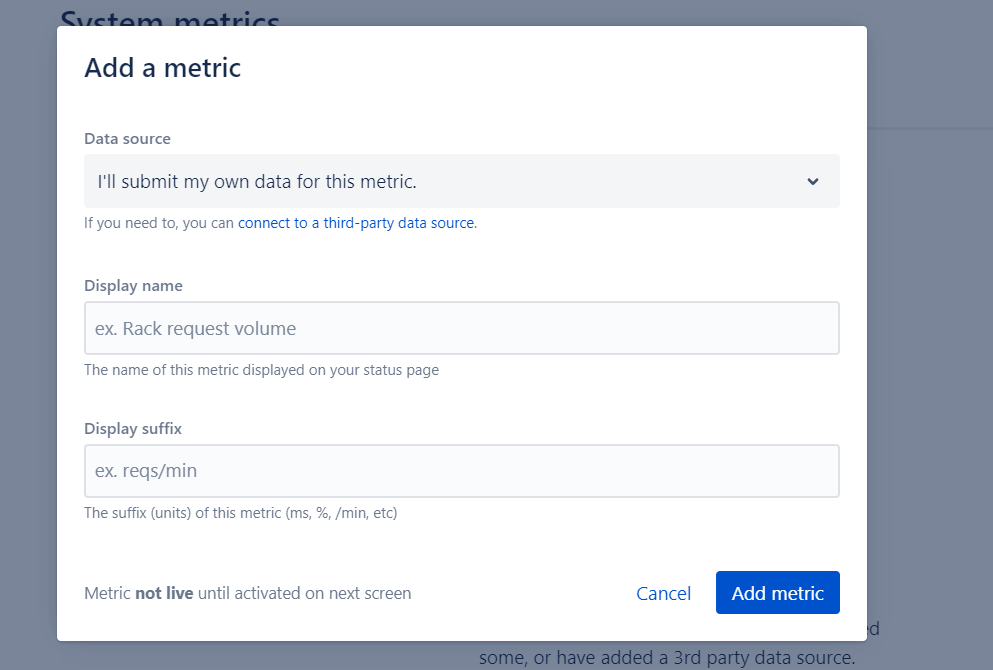
Within the Metrics tab you can use to add your own data. Is this possible for the products mentioned above?
1 answer
Hi @Howard Nedd ,
This is Darryl. I am here to help.
Please note that the System Metrics feature is a way for your monitoring tools to report the metrics of your target services/platforms to your Statuspage via API POST requests.
The common purposes for System Metrics are set to monitor:
-
API response time
-
Web server uptime
-
Average time an outbound request sits on a queue
-
Max time an incoming piece of data sits on a queue before ingested
-
Average time before first reply on customer support requests
-
Current exception rate of all requests
With the Third-party data sources, Statuspage accepts the metrics data reporting from your own monitoring platforms including Pingdom, New Relic, Librato, and Datadog to monitor your target services/platforms.
Documentation of System Metrics
The target services/platforms that you would like to monitor are the Atlassian stacks which are all running & health-maintaining on Atlassian Cloud, which makes the System Metrics may not be ideal in this case.
The feature that I would recommend to you is the Third-party Components.
With that feature, you can add and subscribe to the Atlassian stacks as your Components to keep posted with the statuses officially updated by Atlassian.
I have just confirmed, this feature includes Jira, JSM, Confluence, and Opsgenie.
Hope this helps.
Kind regards,
Darryl Lee
Support Engineer, Atlassian


You must be a registered user to add a comment. If you've already registered, sign in. Otherwise, register and sign in.