Community resources
Community resources
- Community
- Products
- Jira Software
- Questions
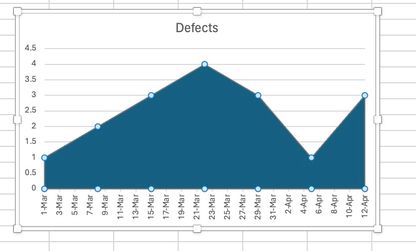
- 2D Area Chart for Defect Backlog in JIRA
2D Area Chart for Defect Backlog in JIRA


1 answer

Hi @Kevin Young,
As far as I know, Jira does not have such native gadget.
But this can be easily done by using the Cumulative Flow Diagram Chart gadget offered by our Great Gadgets app.
All you have to do is to configure the gadget with a filter/JQL that returns the bugs that you want to track and it will display the number of bugs in each category (configurable by you), like status categories (To Do, In progress or Done) as in this example:
But if you want to display only the open (not-resolved) bugs, you have the possibility to hide the Done category.
See more example of this gadget (and the many others offered by the same app) in this article: https://community.atlassian.com/t5/App-Central/How-to-track-scaled-agile-SAFe-projects-in-Jira-with-Great/ba-p/1929694
Hope this helps. If you have any questions, please don't hesitate to contact support@stonikbyte.com.
Danut.

Was this helpful?
Thanks!
Community showcase
Atlassian Community Events
- FAQ
- Community Guidelines
- About
- Privacy policy
- Notice at Collection
- Terms of use
- © 2024 Atlassian


You must be a registered user to add a comment. If you've already registered, sign in. Otherwise, register and sign in.