Community resources
Community resources
- Community
- Products
- Jira Service Management
- Questions
- Can't Get Dashboard "SLA Success Rate" or "SLA met vs breached" to Populate
Can't Get Dashboard "SLA Success Rate" or "SLA met vs breached" to Populate
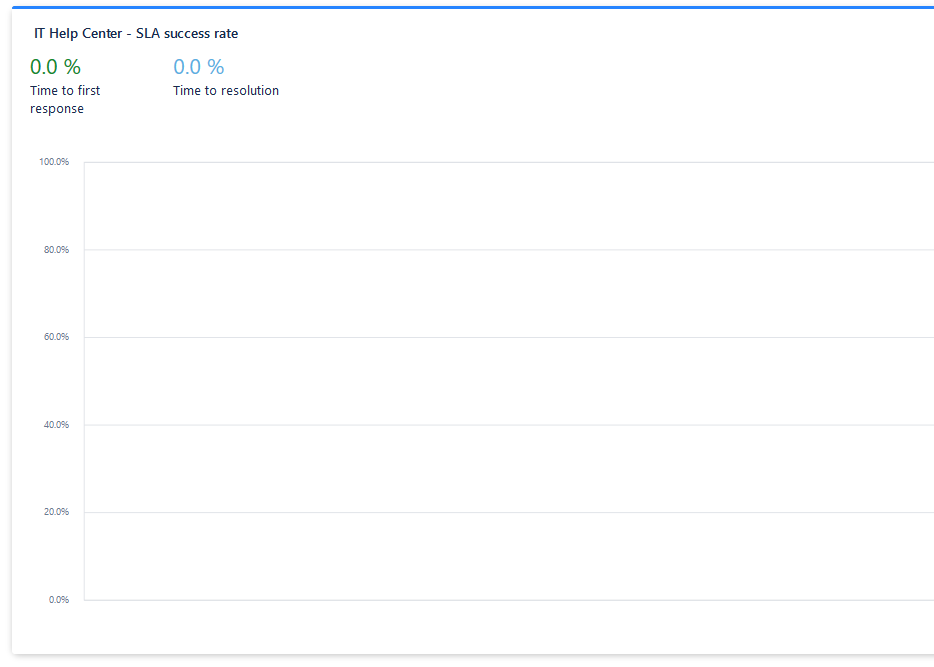
I have setup a couple of basic SLA's, however, the dashboard widgets "SLA Success Rate" or "SLA met vs breached" will not populate (they are empty)
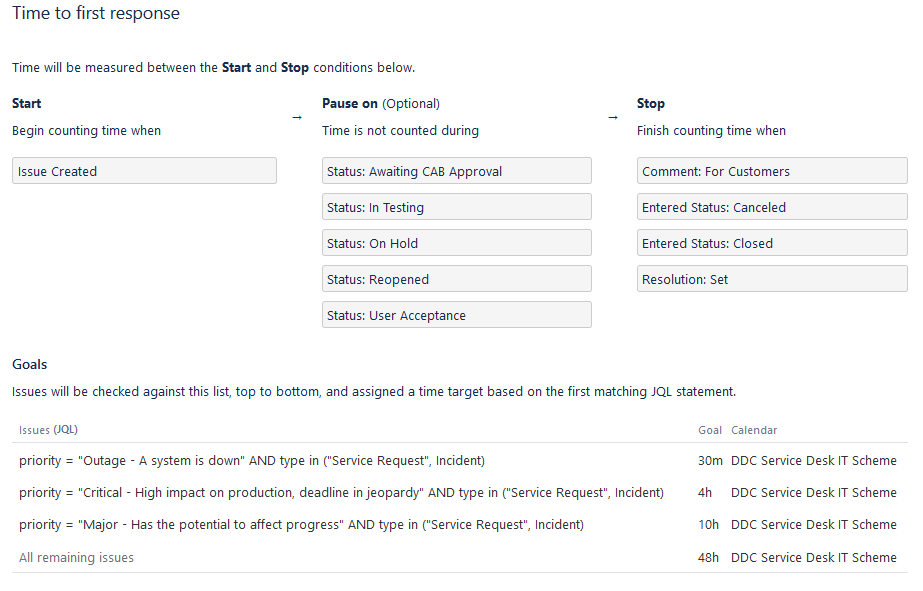
I have attached picture of one of the SLA definitions we are testing:
And this is what the dashboard widget looks like:
Any help with what I am doing wrong would be appreciated.
2 answers
Hello @eford
Sorry to hear you are facing this problem.
Checking the screenshots you provided, your SLAs and issues are properly configured to display in the SLA report, so I believe your SLA Success Rate Report must be configured with some JQL filter that might be excluding the issues from the chart.
Please, follow the steps below in order to troubleshoot it:
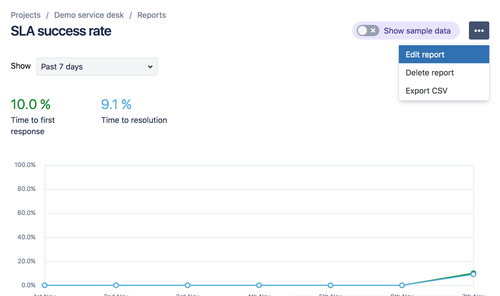
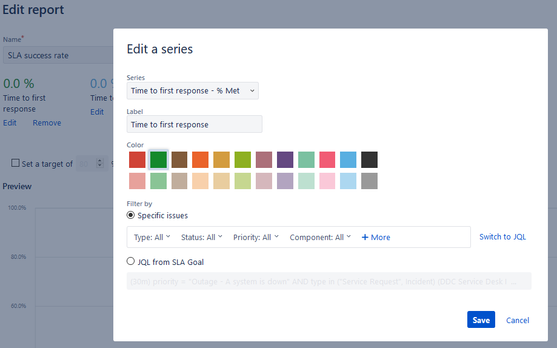
- Navigate to your SD project > Reports > SLA Success Rate > Click to edit it:
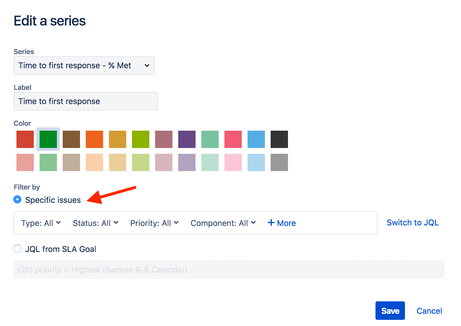
- Click to Edit the series you currently have in your report and check if there is a filter applied to it that might be not considering the issues applied to your SLAs. In fact, clear up the filters and check if the issues are displayed to you:
Let us know if this information helps.
Hello @eford
Thank you for your answer.
That's a really weird problem. I was not able to find any possible bugs or incoherencies that you might be causing this issue.
I have created an internal support ticket for you so we can better troubleshoot this issue:
- https://getsupport.atlassian.com/servicedesk/customer/portal/23/JST-527770
Someone will contact you on this support ticket soon to help you with this problem.
That being said, I know this might be a silly question, but talking about the issues you added in the comments displaying the SLAs concluded, are they part of the same project you are checking the report?
The reports from JIRA service desk have a hidden filter that only displays issues of that specific project, however, I'm not sure if you are using more than a single project in your site. I suggest you use the following query so you can better determine if that are issues with SLA complete in your project, where "yourproject" is the project you are checking the report:
project = "yourproject" and "Time to first response" = completed()
Let me know what are the results of the query above.
You must be a registered user to add a comment. If you've already registered, sign in. Otherwise, register and sign in.
I have 1 Service Desk project and 1 Software project. However, I am only looking at the SD project in this case and the query provided shows that I do actually have the tickets in there.
Thanks for creating the support ticket. I'll start putting comments in there as needed or is helpful.
You must be a registered user to add a comment. If you've already registered, sign in. Otherwise, register and sign in.
Thank you again for this information, @eford
I have contacted our Service Desk support team to prioritize your ticket, so they should be contacting you soon to take a closer look at the issue and properly troubleshoot it.
Again, thank you a lot for your patience and detailed answers.
You must be a registered user to add a comment. If you've already registered, sign in. Otherwise, register and sign in.

Hi,
If you look in your queues do you actually see issues that have a value in the Time to first response?
In your report What is your time period. The default is Past 7 days, perhaps you don't have any current issues?
Susan
You must be a registered user to add a comment. If you've already registered, sign in. Otherwise, register and sign in.

Hi,
Do you have any where the time to first response has completed? Use jql "Time to first response" = completed(). Because if it's still running, I don't think that report will pick it up.
Susan
You must be a registered user to add a comment. If you've already registered, sign in. Otherwise, register and sign in.

However, did the completion of the time to respond happen in the last 7 days.
Try expanding your report out to months and see what you get.
You must be a registered user to add a comment. If you've already registered, sign in. Otherwise, register and sign in.
The ticket detail I showed in the 2nd screenshot was created and resolved yesterday. However, I opened up the timeframe to "Past Year by Week" and everything is still blank.
You must be a registered user to add a comment. If you've already registered, sign in. Otherwise, register and sign in.

I'm stumped. Let me escalate internally.
You must be a registered user to add a comment. If you've already registered, sign in. Otherwise, register and sign in.

Was this helpful?
Thanks!
Atlassian Community Events
- FAQ
- Community Guidelines
- About
- Privacy policy
- Notice at Collection
- Terms of use
- © 2024 Atlassian




You must be a registered user to add a comment. If you've already registered, sign in. Otherwise, register and sign in.