Have more fun with Kudos
- Collect badges and make progress
- Participate in fun challenges
- Climb up the leaderboard
- Gift Kudos to your peers
Community resources
Community resources
Community resources
- Community
- Products
- Confluence
- Questions
- Release Burndown reports from Jira to Confluence
Release Burndown reports from Jira to Confluence
I want to know how I can get burndown charts and/or release burndown charts for multiple projects from Jira into one location in Confluence? Does this require the cloud version of Jira/Confluence?
1 answer

Hi @[deleted],
We can recommend you to try our app - the Table Filter and Charts for Confluence. It works for all Confluence hostings (Server, Data Center and Cloud), so you don't need to switch to Cloud from your Server version.
Here is step-by-step guide with screenshots how to create Burndown charts in Confluence.
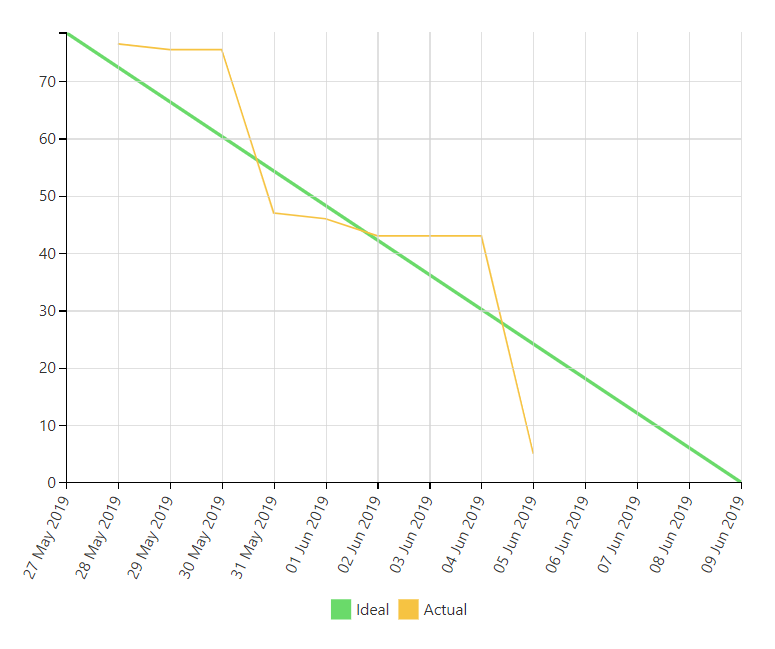
All you need to do is to wrap the Jira Issues macro successively into several macros provided by the Table Filter and Charts app. As a result, you'll get two pivot tables for actual and ideal "burning" of story points. Then you'll be able to visualize them with the advanced Chart from Table macro:


You must be a registered user to add a comment. If you've already registered, sign in. Otherwise, register and sign in.