Community resources
Community resources
Community resources
Performance in Jira front-end, Part 1: the story of a single line of code
At Atlassian, we are continuously working to improve the performance of Jira Cloud. This is something we've mentioned a number of times in the past: backend improvements found through profiling, changing serialization formats, introducing server-side rendering, and improving our React architecture.
This is the first in a series of three blogs focusing on the front-end side of the performance story, covering some of the work that we've been doing in order to reduce the amount of JavaScript required to render pages in Jira Cloud. In this blog, we'll delve into the process of discovering and implementing a relatively small fix that yields a meaningful reduction in bundle size.
JavaScript assets are some of the most computation-intense assets on a page, because they take time to download, compile, parse, and execute. Put simply, if we decrease the amount of JavaScript we serve, it will decrease the load on the browser and make our application faster. Of course, this would be easy if we were able to remove features, but in practice, this is rarely the case! Instead, our goal is to ship less JavaScript, all while continuing to offer new features and build a rich web application.
Investigating the bundles
In order to reduce the size of our JavaScript bundles, we first have to get a better understanding of their content. To start this performance investigation, we'll use the following basic strategy:
- Start by executing an experience, as a user would
- Scan and identify a performance improvement opportunity
- Drill inwards on the implementation (then go back to step two until you…)
- Find a discrete issue with an actionable fix
We’ll begin by inspecting the Jira dashboard page, which seems as good a place as any to start:
- Visit Jira dashboard
- Open Chrome Devtools → Network Tab
- Turn on "Group by Frame" (under the network settings cog) to remove iframe noise
- Do a clean load (CMD + R) and disable recording after loading completes (CMD + E)
- Sort network assets by file size
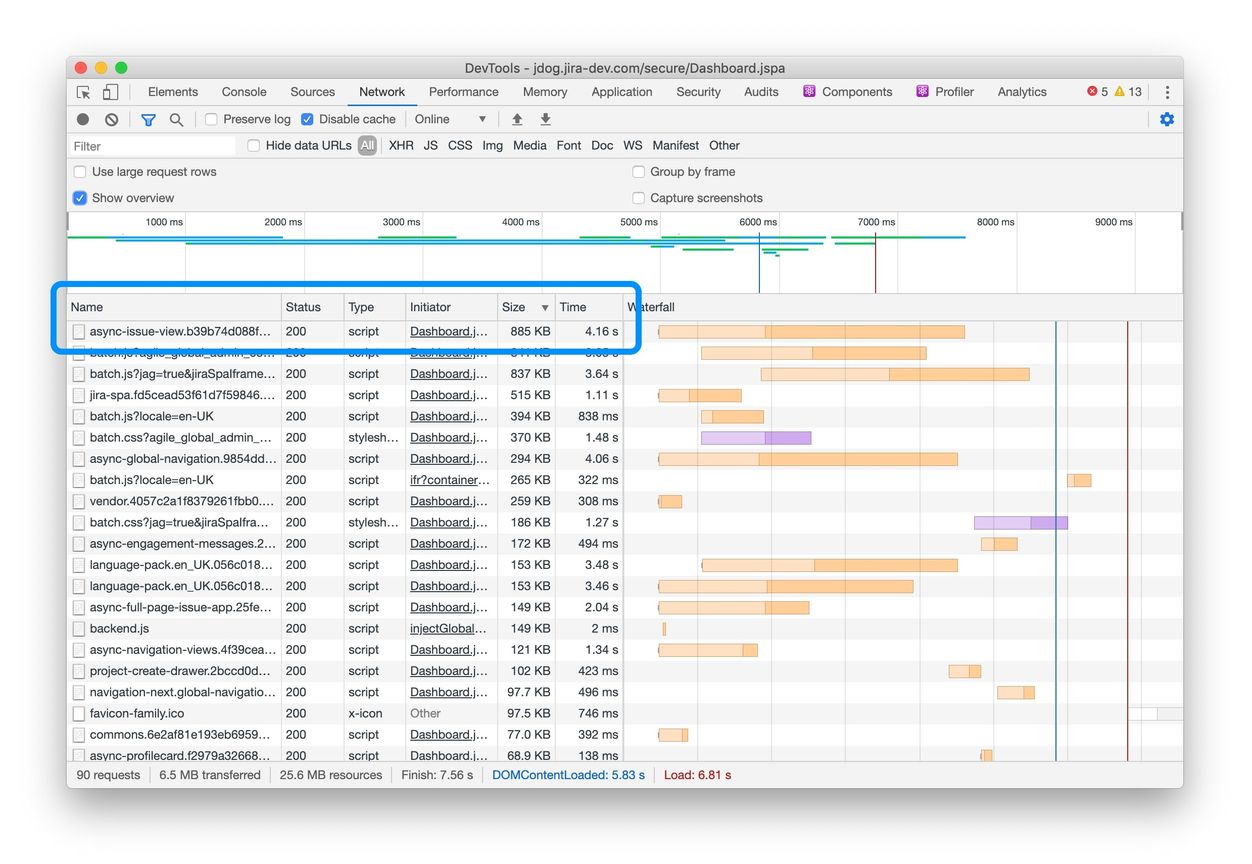
It’s clear from this exercise that async-issue-view.js is a particularly big resource.
- Network/gzip size: 892 KB
- Actual resource size: 4.1 MB
- Time cost: 4.16 seconds
This bundle is large because it contains a lot of functionality. However, this also means there might be more opportunities for improvement. Let's have a closer look at it:
- Run webpack-bundle-analyzer to visualize the content of the bundle
- Look at the bundle analysis
- Stop when you see something that looks inefficient 🤨
Once we've found a potential source of inefficiency, we'll dive into more detail.
1. Run Webpack bundle analyzer
In Jira front-end, we have a script to run webpack with webpack-bundle-analyzer:
// in package.json
{
    "scripts" : {
        "bundle-analyze": "BUNDLE_ANALYZE=1 yarn webpack"
    }
}

// in webpack.config.js
const { BundleAnalyzerPlugin } = require('webpack-bundle-analyzer');

const plugins = [];
if (process.env.BUNDLE_ANALYZE === '1') {
    plugins.push(new BundleAnalyzerPlugin(/* options */));
}

const webpackConfig = {
  // other configuration options
  plugins: plugins,
};
This generates a bundle analysis report and package visualization. Once it's finished, open the bundle analysis and have a look.
2. Looking at the bundle analysis
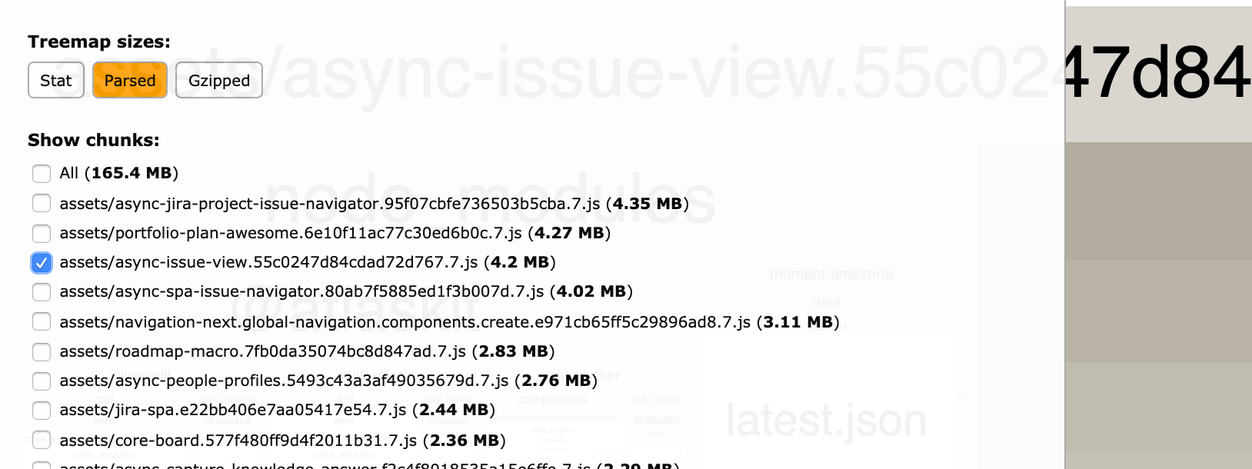
Now that we have the report open, let's investigate. First, we'll focus only on the bundle we care about, to make exploration easier.
- Move the mouse over the left-hand margin to display the bundle/chunk selector
- Uncheck “All” to hide all chunks, then check
async-issue-view.js
From here, we can dive in anywhere we want on the module map, but as a general guide:
src(right) contains code that is written directly by feature teams working on Jira Cloud- node_modules (left) contains dependencies
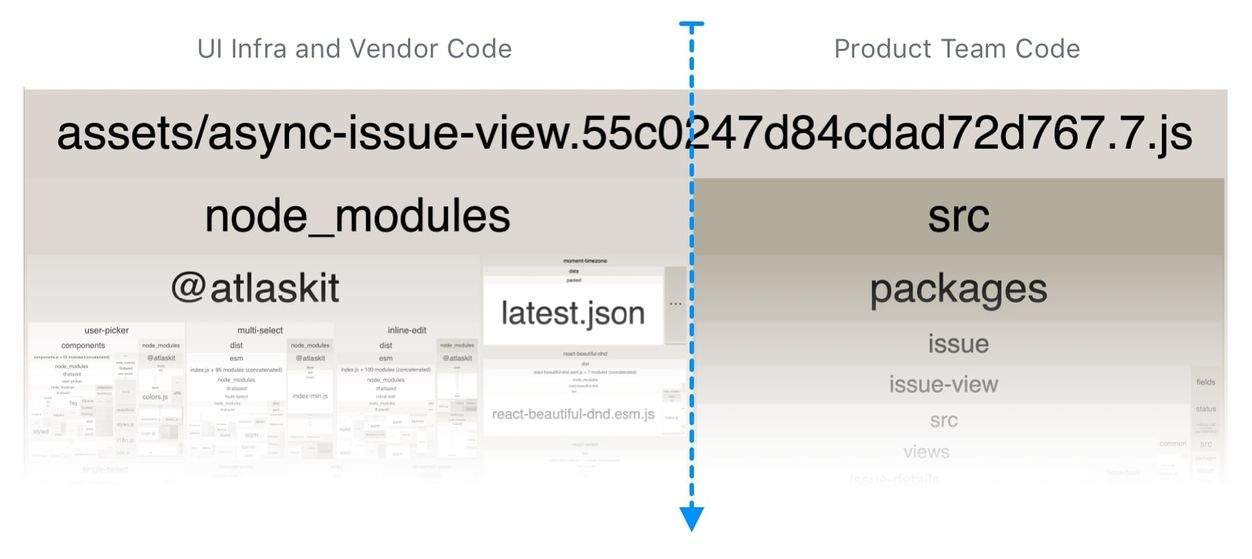
Since we’re going for easy product wins, let’s stick to src on the right side for now. Glancing around the src area, one box that jumps out is “asset-tracking.”
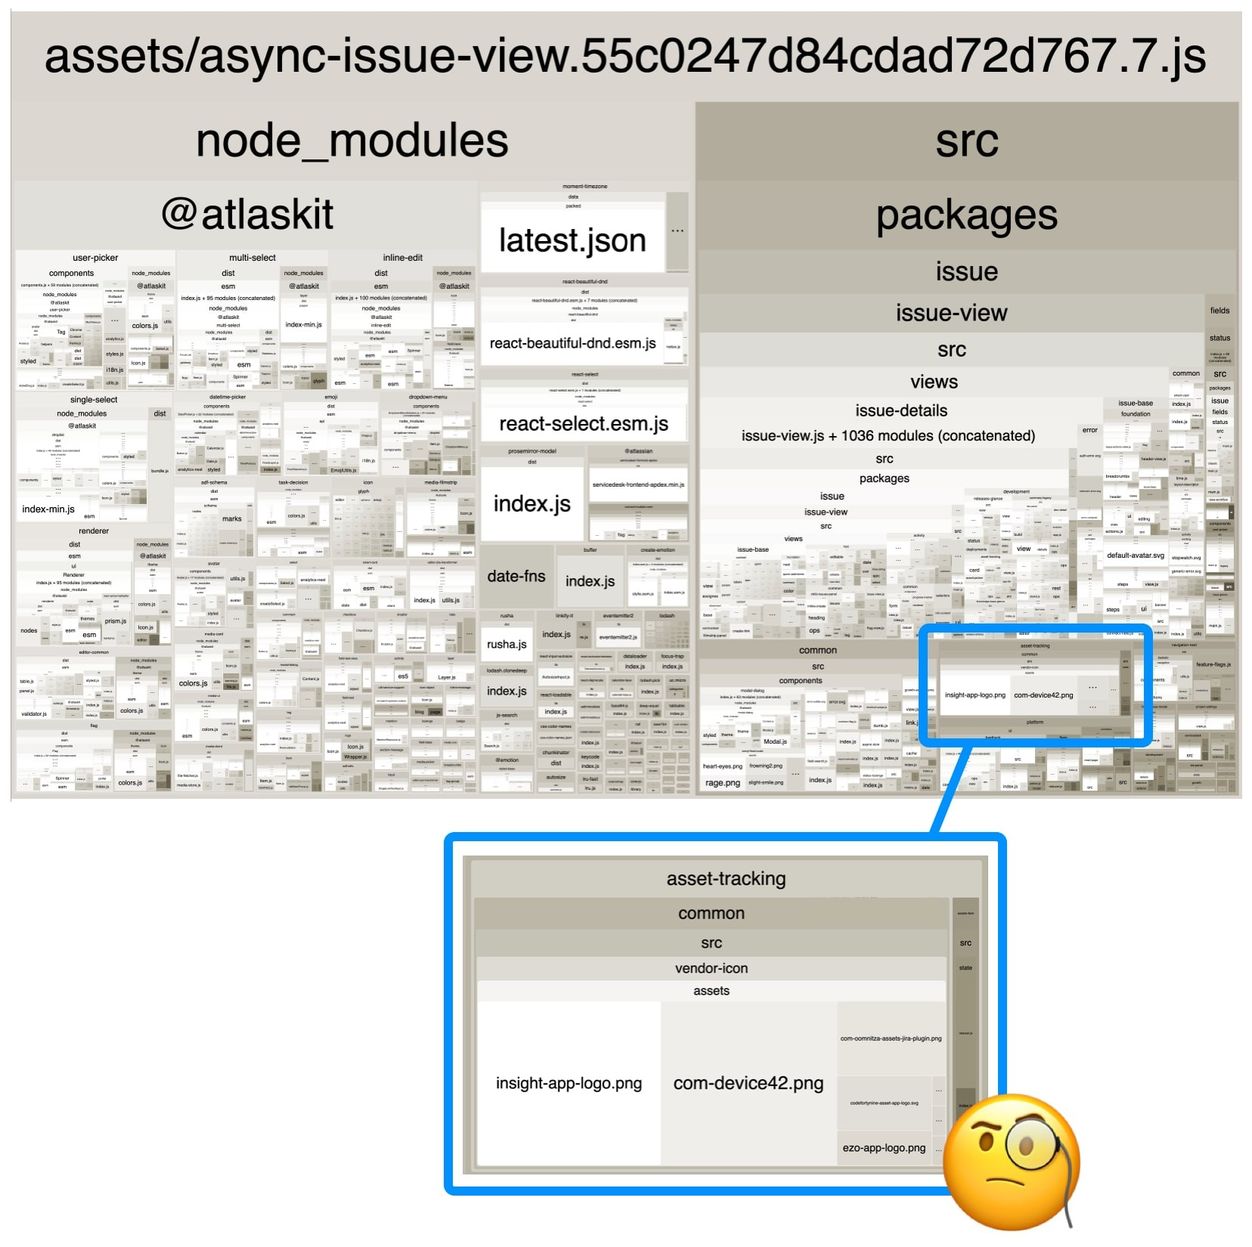
3. Stop when you see something that looks inefficient 🤨
The "asset-tracking" block stands out for a few reasons:
- It only consists of a small number of items relative to its overall sizing footprint
- Several of those items are very large
- They appear to be PNG images Base64 encoded into the JS source bundle
Inlining large images as strings using Base64 encoding in our core JS bundles is definitely not something we want, and needs to be fixed. Looks like we’ve found a good candidate for an easy performance win!
Understanding why things are the way they are
As it stands, every Jira user is paying the price for bundling these inlined image assets, regardless of whether they use the asset tracking product feature. Even for those that engage with the feature, bootstrapping the assets on initial load is highly undesirable. Unlike regular image loads, which can occur in parallel and won't congest resources on the main JavaScript thread, these inlined images directly increase JS download, parsing, CPU, and memory overhead. Things are particularly problematic where async-issue-view is concerned, because this bundle is loaded on key pages of the Jira Single Page Application.
To determine an appropriate fix, we first need to understand what we're dealing with. We'll do that by answering the following questions:
- Where do these assets come from?
- What is causing them to be embedded?
- What do we gain from fixing it?
Let's walk through each of the steps in more detail.
Where do these assets come from?
Taking a quick look at the minified production bundle, we can confirm there are indeed large chunks of Base64 encoded strings for these PNG assets in async-issue-view.js
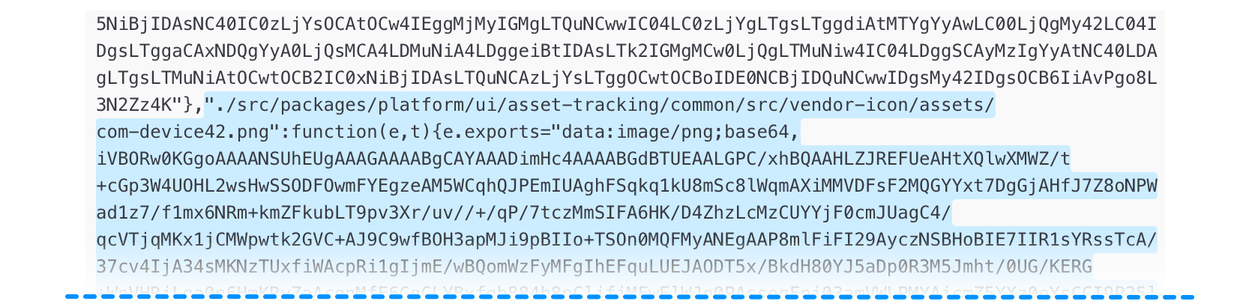
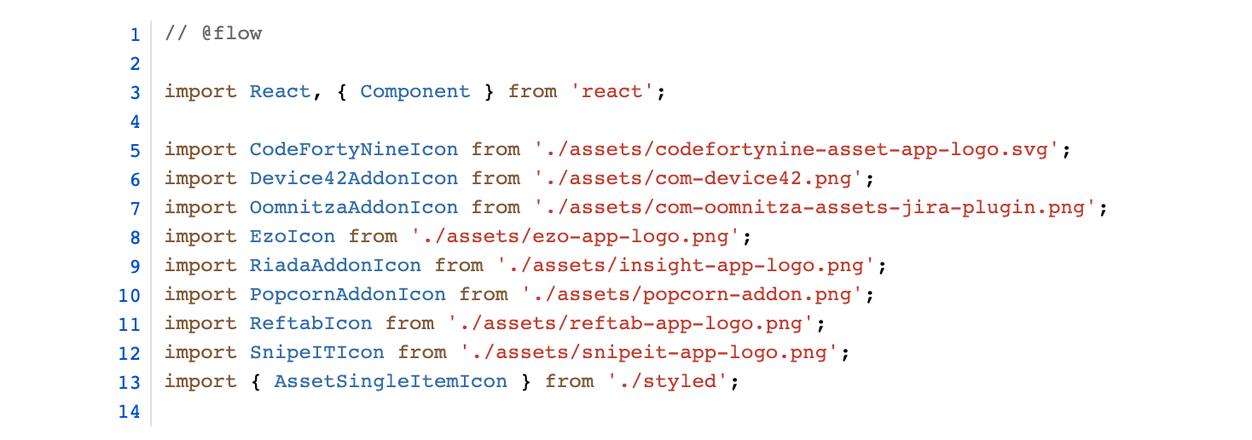
Searching for com-device42.png in Jira front-end brings us to the related implementation:
Dropping down into the assets directory, we find the source images:
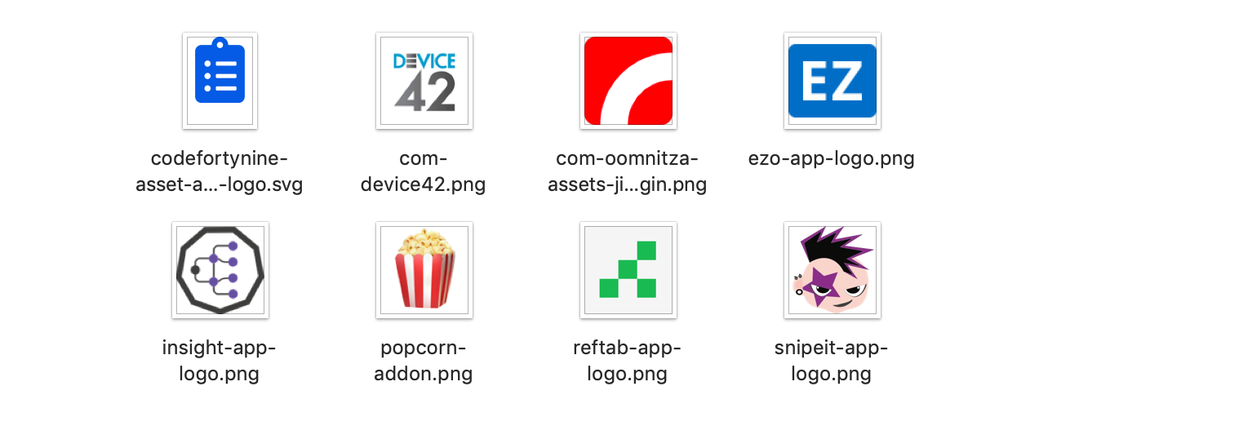
It's obvious from looking at the assets that these images are not relevant to the core user experience critical path, and should be removed from the bundle.
For those who may be curious, these images come from the Jira Service Management – Asset Tracking feature, which provides hardware asset tracking functionality from third-party companies to help organizations manage their internal distribution of laptops, phones, and other devices.
What is causing them to be embedded?
While the image import statements in vendor-icon/index.js are the trigger for why these assets are being included, they aren't the root cause of the issue. JS bundling behavior, like image inlining, will come from a preprocessor or build script. In the case of Jira front-end, that processing functionality is handled by the Webpack JavaScript bundler. Webpack manages its configuration in a config file written in JavaScript called webpack.config.js.
Opening up the config and looking at the bundler modules, we see a reference to a loader for processing image files called url-loader, which transforms files into Base64 URIs
Code: Webpack url-loader config
{
    test: /\.(svg|png|gif|jpeg)$/,
    use: [
        {
            loader: 'url-loader',
            options: {
                name: urlLoaderAssetName,
                limit: assetSizeInliningThreshold,
            },
        },
    ],
},
We're getting close!
Quick side note for Webpack experts: If you've been screaming "it's url-loader, you clown!" for the last few paragraphs, that's fine. The lesson here is not about having domain knowledge in one system or another. It's about strategies we can use to operate successfully in unknown areas where we may have little to no context or past experience.
Looking at how url-loader works, the key part we care about is the limit value provided by the assetSizeInliningThreshold constant.
Code: url-loader asset size limit
{
    loader: 'url-loader',
    options: {
        limit: 10000,
    },
}
There's our issue right there. This threshold means that we are allowing images up to 10KB to be imported and inlined into our critical JS bundles.
Before HTTP/2 was introduced, every request a browser performed had a significant overhead. On top of that, every browser tab had a limit of active connections per domain. This means multiple small requests could have significantly degraded page load performance. In order to mitigate this issue, webpack introduced the option to inline resources using data-urls. This allowed users to reduce the number of request page makes by embedding the contents of the resources in Base64 format within JavaScript assets.
With the introduction of HTTP/2, extra requests no longer incur significant costs or significantly impact performance. We need to completely disable it, or at a minimum have the upper threshold significantly reduced to a value of no more than 1KB (and ideally only inline SVGs).
What do we gain from fixing this?
To understand the benefits we gain and issues we mitigate by disabling image inlining (or significantly reducing the threshold limit), we need to understand how Base64 encoded inlined images negatively impact performance.
There are some valid use cases for inlined images:
- Test if the browser supports certain image capabilities (eg. WebP support check)
- Micro-images or micro-tiles that sprite poorly (eg. transparent gradient overlay tiles)
For all other scenarios, the performance equation will result in a net negative overall outcome. Embedded data URIs are downloaded and parsed, even if they are not used, and cannot be cached. And, as noted above, HTTP/2 diminishes the upside of request consolidation.
Another substantial downside to image inlining is that Base64 encoded strings respond poorly to Gzip and Brotli compression because the compressed output size relative to input size is worse than comparable amounts of regular JavaScript code. In this way, inlined images can be seen as wastefully consuming a JavaScript module’s "code budget" compared to equal amounts of application code.
To demonstrate, let's compare Gzip and Brotli compression outcomes for the Base64 inline image code with an equally sized chunk of regular code from async-issue-view.js.
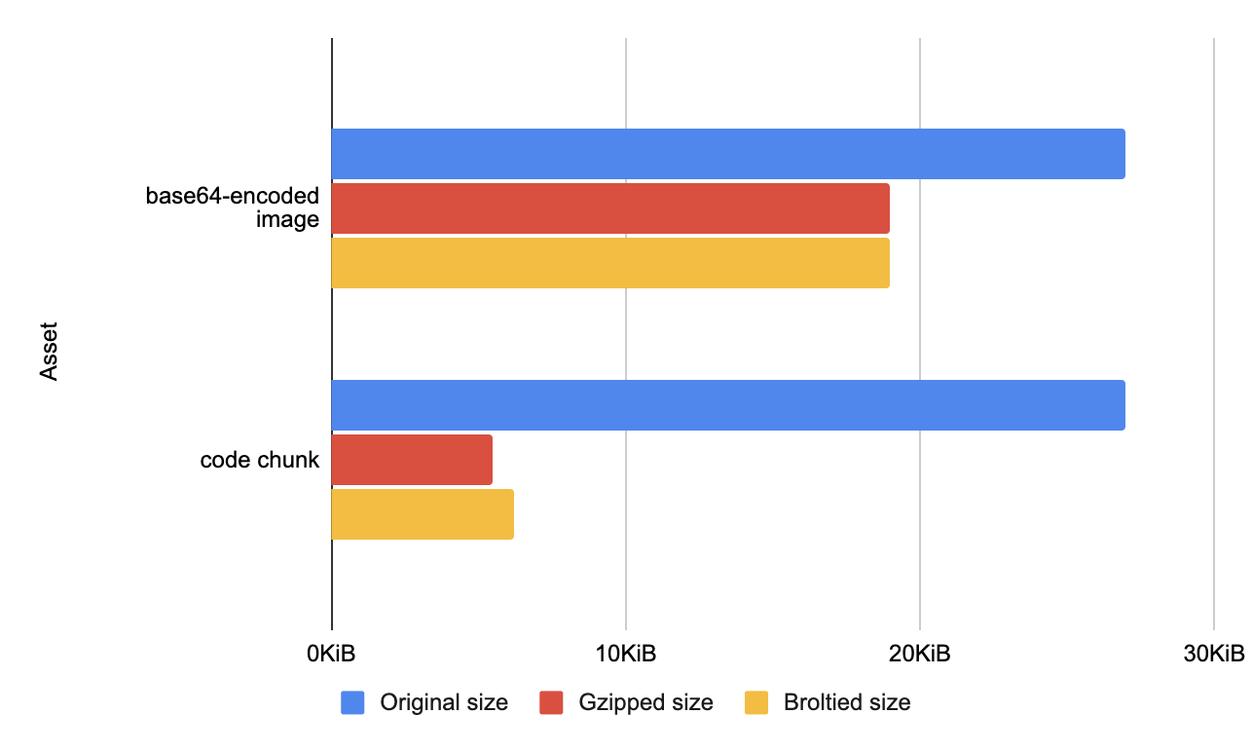
From these results, we see that 27KB of image code displaces approximately 90KB of regular JavaScript application code (e.g., 90KB JS at 80% compression rate === 27KB images at 30% compression)
Recommended reading
- Performance Anti-Patterns: Base64 Encoding
- Why “optimizing” your images with Base64 is almost always a bad idea
- Google Web Fundamentals: Inline images pros and cons
- Google Web Fundamentals: Webpack image embedding considerations
- Base64 Encoding and Performance
Measure, validate, demonstrate
Performance-sensitive changes require additional work to measure and demonstrate results. Validating outcomes ensures we move performance in the right direction and apply the right trade-offs. For the validation step, we’ll compare resource output from our two build configurations, measuring the impact on JS file size and image count.
The original configuration inlines all imported png, gif, jpg and SVG images under 10KB into JavaScript source. The new configuration disables all Base64 encoded image inlining.
To know what to measure, we'll first define the questions we need our data to answer.
Q: How many files are inlined in JavaScript and how many are disk/network-based?
Impact: Network request overhead, CDN and browser cache efficiency
Q: What is the raw JS file size impact for all inlined files?
Impact: JS download, parse, CPU/memory overhead
Q: What inlined files appear in multiple JS bundles, and how many times are they repeated?
Impact: Resource use optimization, JS download, parse, CPU/memory overhead, CDN and browser cache efficiency
Q: What duplicate disk/network image exists? (eg. people copy/pasting the same image)
Impact: Resource use optimization, Network request overhead, CDN and browser cache efficiency
Global outcome results
Our first measurement will be of the impact of our proposed changes from the perspective of the entire Jira front-end.
| Parameter | Before | After |
| Total number of disk/network images | 87 | 229 (+142) |
| Total number of JS inlined images | 507 | 0 (-507) |
| Impact to raw JavaScript file size | 2.07MB | 0 (-2.07MB) |
| Unique duplicated inlined assets count | 84 | 0 (-84) |
| Duplicate disk/network images | 4 | 22 (+18) |
Total number of disk/network images
An increase in disk images may superficially appear as a negative when evaluated against minimizing network round trips, but that's only half the story; it's the actual triggered network fetches that define the real-world impact. Many of these assets will never be fetched for a typical session, and therefore add no network cost, unlike the inlined assets that incur their complete cost for all users regardless of whether or not they are required.
Through call site evaluation and local network inspection, the overall request frequency of these images is very low, giving us a net positive outcome. Shifting to regular image assets also provides the following performance benefits:
- Non-rendered images will no longer be force-fetched
- Network images can now be CDN and browser cached
- HTTP/2 reduces the value of network reduction relative to JS payload impact
Name and frequency of duplicate inlined images across JS files
Having multiple inlined assets duplicated across many different modules is really unfortunate, and needs to be fixed.
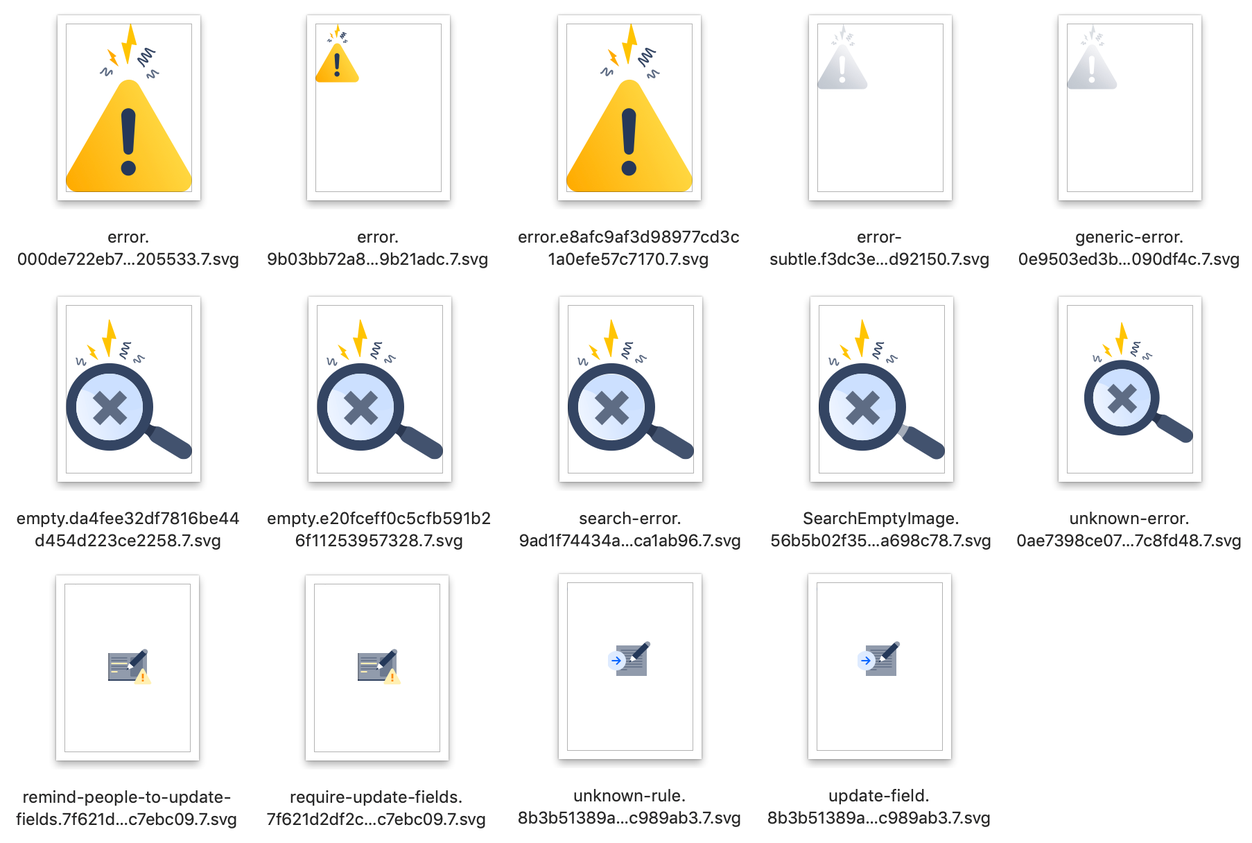
error.svgis duplicated 52 times across modules in a unique un-cacheable format. Separate from this, there are three independent but identical variations of the same SVG being used across the code base.emoji-fixed-scaleinline assets incur their download cost up to 22 unique times across 5 assets, aggregating to 110 potential image instances. This grows each time a new module imports the assets (eg. 23 → 115, 24 → 120, 25 → 125, etc). Regular network PNGs would download once for the session and cap out at a maximum of 5 asset instances.
Name and frequency of duplicate network images
Duplicate disk-based images are a problem, but seeing the duplicate image counts increase with the new configuration is a positive outcome. We now have clear visibility of the assets that are wastefully mirrored across the code base. Consolidating these assets into a single canonical version and updating call sites makes for a very easy follow-up task that will deliver additional performance gains.
This is in stark contrast to the inline scenario, where 52 repeat copies of error.svg and 22 copies of each emoji-fixed-scale image exist across multiple JS modules. It is a lot harder to fix duplication issues in the case of inlined assets.
Local outcome results
To get localized perspective on how this global change will impact specific experiences, we'll run an analysis on two representative samples. For this test, we picked loading the Jira Projects directory page, and a Jira Next-Gen board.
| Parameter | Jira Projects before | Jira Projects after | Jira Next-Gen Board before | Jira Next-Gen Board after |
| Total number of disk/network images | 0 | 2(+2) | 0 | 0 |
| Size of disk/network images | 0 | 1.84KB (+1.84KB) | 0 | 0 |
| Total number of inlined images | 52 | 0 (-52) | 57 | 0 (-57) |
| Total inline image impact to JavaScript file size | 246KB | 0 (-246KB) | 264KB | 0 (-264KB) |
Note: “Before” for disk/network images sets the relative starting baseline at zero. It does not mean there were zero images overall
Small changes can equal big outcomes
When doing this type of performance work, the majority of your time and effort will be spent discovering, understanding, measuring, and validating opportunities. Code output often ends with small diffs that change very selective parts of code in very deliberate ways.
For our example – after it's all said and done – we "delivered" a one-line code change.
diff --git a/webpack.config.js b/webpack.config.js

@@ -535,7 +534,7 @@
- limit: assetSizeInliningThreshold,
+ limit: false,
The example we discussed in this blog surfaced organically through exploration. While the specific case-study around the tradeoffs for image inlining is quite technically interesting, what matters most is the process of discovery of impactful potential changes, rather than the nature of the change itself.
This particular investigation and change was just one of the many pieces of work that we have done, and are continuing to do, in order to address bundle sizes in the Jira front-end, and as part of tackling the larger challenge of application performance.
Was this helpful?
Thanks!
Alexey

2 comments