Community resources
Community resources
Community resources
🔑 Unlock team productivity with Time in Status for Jira Cloud 🔑
Let's say you work in a software development team that uses Jira to manage your projects. You've recently noticed that some issues seem to be getting stuck in the "In Progress" status for longer than usual, and you're not sure why. You want to identify where the bottleneck is and improve your team's workflow.

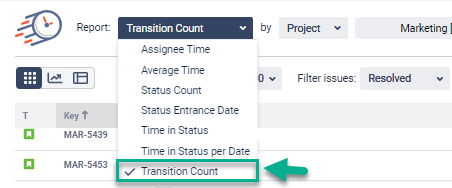
In this case, you could use Time in Status for Jira Cloud. Our add-on helps teams track how much time issues spend in each status. It offers a range of features that make it easy to track progress and optimize workflow, including real-time notifications, customizable reports, and data visualization tools. One of the key report for this aim is a Transition Count report.
The Transition Count report is useful for several reasons:
- provides teams with valuable insights into their workflow
- tracking the progress of an issue
- tracking team performance
- identify areas where they are getting stuck or where there is a bottleneck
- identify areas where they can improve and make adjustments to their workflow.
- teams can get a better idea of how much work has been done on that issue
With this information, you can identify which issues are causing the bottleneck and work with your team to find a solution. For example, you may find that some issues are blocked by dependencies or require more resources, or that certain team members are overwhelmed with work. By addressing these issues, you can optimize your team's workflow and reduce cycle times.
How to set up this report?
Choose the Transition Count report
- Filter by the category you need.
- Choose the date ranges for the data calculation;
- Choose the time format type that will be represented on the grid;
Get the transition count data on the grid as it’s shown below.
For example, the task was in the To-Do status, then moved to the In Progress status. So, the transition count between To-Do and In Progress statuses is 1. Then the task moved to other statuses and after a while, the task returned to the To-Do status and then moved back to In progress. So the transition count between To Do and In Progress statuses is 2.
The calculation of the report on the Chart view occurs according to the selected period. The transition count report calculates the number of transitions between statuses for the tasks in the chosen period.
For example - on Monday 4 tasks from 6 have had To Do -> in progress transitions for 2, 3, 4 and 4 times. So, the transition count for To Do -> In Progress on Monday is 2 + 3 + 4 + 4 = 13
Takeaway

The Time in Status for Jira Cloud plugin offers various features that make reports easy to use and explore. You can find more information about our add-on by exploring the plugin's documentation page. We are grateful to our users for providing feedback and suggestions that have helped us develop a more user-friendly and practical app.
If you haven’t try the add-on yet, you are welcome to start your 30-days free trial.
Was this helpful?
Thanks!
Valeriia_Havrylenko_SaaSJet
About this author
Product Marketer
SaaSJet
39 accepted answers
TAGS
Atlassian Community Events
- FAQ
- Community Guidelines
- About
- Privacy policy
- Notice at Collection
- Terms of use
- © 2025 Atlassian


2 comments