Community resources
Community resources
Community resources
Revealing Operational Excellence: Identifying Bottlenecks through Metrics like Cycle Time, Lead Time
In the fast-paced business world, where time is money, optimizing processes and enhancing efficiency are crucial for success. So, let's dive in and talk about how we can uncover those operational bottlenecks and make your workflows as smooth as butter.
Alright, folks, here we go!

One effective way to pinpoint bottlenecks is through the analysis of key metrics such as Cycle Time, Lead Time, Response Time and Resolution Time.
Getting to Know the Metrics:
- Cycle Time:
- Definition: Cycle time is the duration from the moment where the actual work on a work item starts, to the moment when all the work is completed.
- Strategic Insight: Cycle Time shows the time of the actual work. Shorter cycle times typically indicate a more efficient process. Monitoring cycle times or its constituents can help identify tasks that may cause delays or impede workflow progression.
- Lead Time:
- Definition: Lead time for a task is the duration from its entrance to the pipeline, to the task completion. The clock starts ticking as soon as the work item is created (or enters the work queue) and stops ticking when all the work is completed. The main difference between Cycle Time and Lead Time is: Lead Time also includes the wait time the task spends in the work queue. Lead time is always longer than Cycle Time.
- Strategic Insight: Lead Time shows the total time until the results are delivered. Longer lead times point to bottlenecks in the workflow or overall capacity problems. Breaking down lead times into their constituent parts can help identify specific stages that cause delays.
- Response Time:
- Definition: Response Time measures the elapsed time between the creation of a task (or the reporting of an issue) and the beginning of actual work (or any kind of response is returned to the task’s customer).
- Strategic Insight: A prompt response time is critical for customer satisfaction and streamlined workflows. Longer response times usually point to capacity problems. Monitoring response times helps identify areas where immediate attention is needed, preventing potential bottlenecks from escalating.
- Resolution Time:
- Definition: Resolution Time focuses on the duration it takes to resolve issues or incidents, often measured from the moment a problem is reported, to its eventual resolution. The main difference between Lead Time and Resolution Time is: Lead Time starts when the task is actually put in the queue (the task might be waiting in the backlog before you decide to work on it and put it in the work queue) while Response Time starts when the request is made by the customer. In other words, Lead Time starts when you pull the task from the backlog but the Response Time also includes the wait time in the backlog.
- Strategic Insight: Resolution Time is the total time a customer of a task needs to wait to get the requested resolution. It reflects the experience of the customer. High resolution times cause customer satisfaction issues. Analyzing resolution times can reveal areas where improvements, whether in skills, resources, or tools, could enhance overall efficiency.
Reporting and Analysis:
- Establish Clear Baselines:
- Before diving into metrics analysis, it's essential to establish baseline values for Cycle Time, Lead Time, Resolution Time, or any other metric. This provides a benchmark against which you can measure future performance.
- Regular Reporting:
- Implementing regular reporting mechanisms allows teams to stay informed about their performance. Consistent reporting helps in identifying trends and patterns over time, making it easier to pinpoint bottlenecks.
- Comparative Analysis:
- Comparative analysis involves assessing current metrics against historical data or industry benchmarks. This helps in understanding whether current performance aligns with expectations and where improvements may be needed.
Alright, now that we've got the groundwork laid out, let's talk about a tool that makes this whole metrics game a breeze. To perform the required analysis, it is important to have a tool that streamlines the measurement process when identifying bottlenecks through metrics. Timepiece - Time in Status for Jira by OBSS, is Jira app built for this purpose. It works with all editions of Jira (Work Mng, Software, Service Mng, Product Discovery). It is available for both Jira Cloud, and Data Center.
Timepiece - Time in Status for Jira empowers you to effortlessly track Issue Age, Cycle Time, Lead Time, Resolution Time, or any other metric directly within JIRA. Say goodbye to manual calculations and say hello to real-time, accurate metrics.
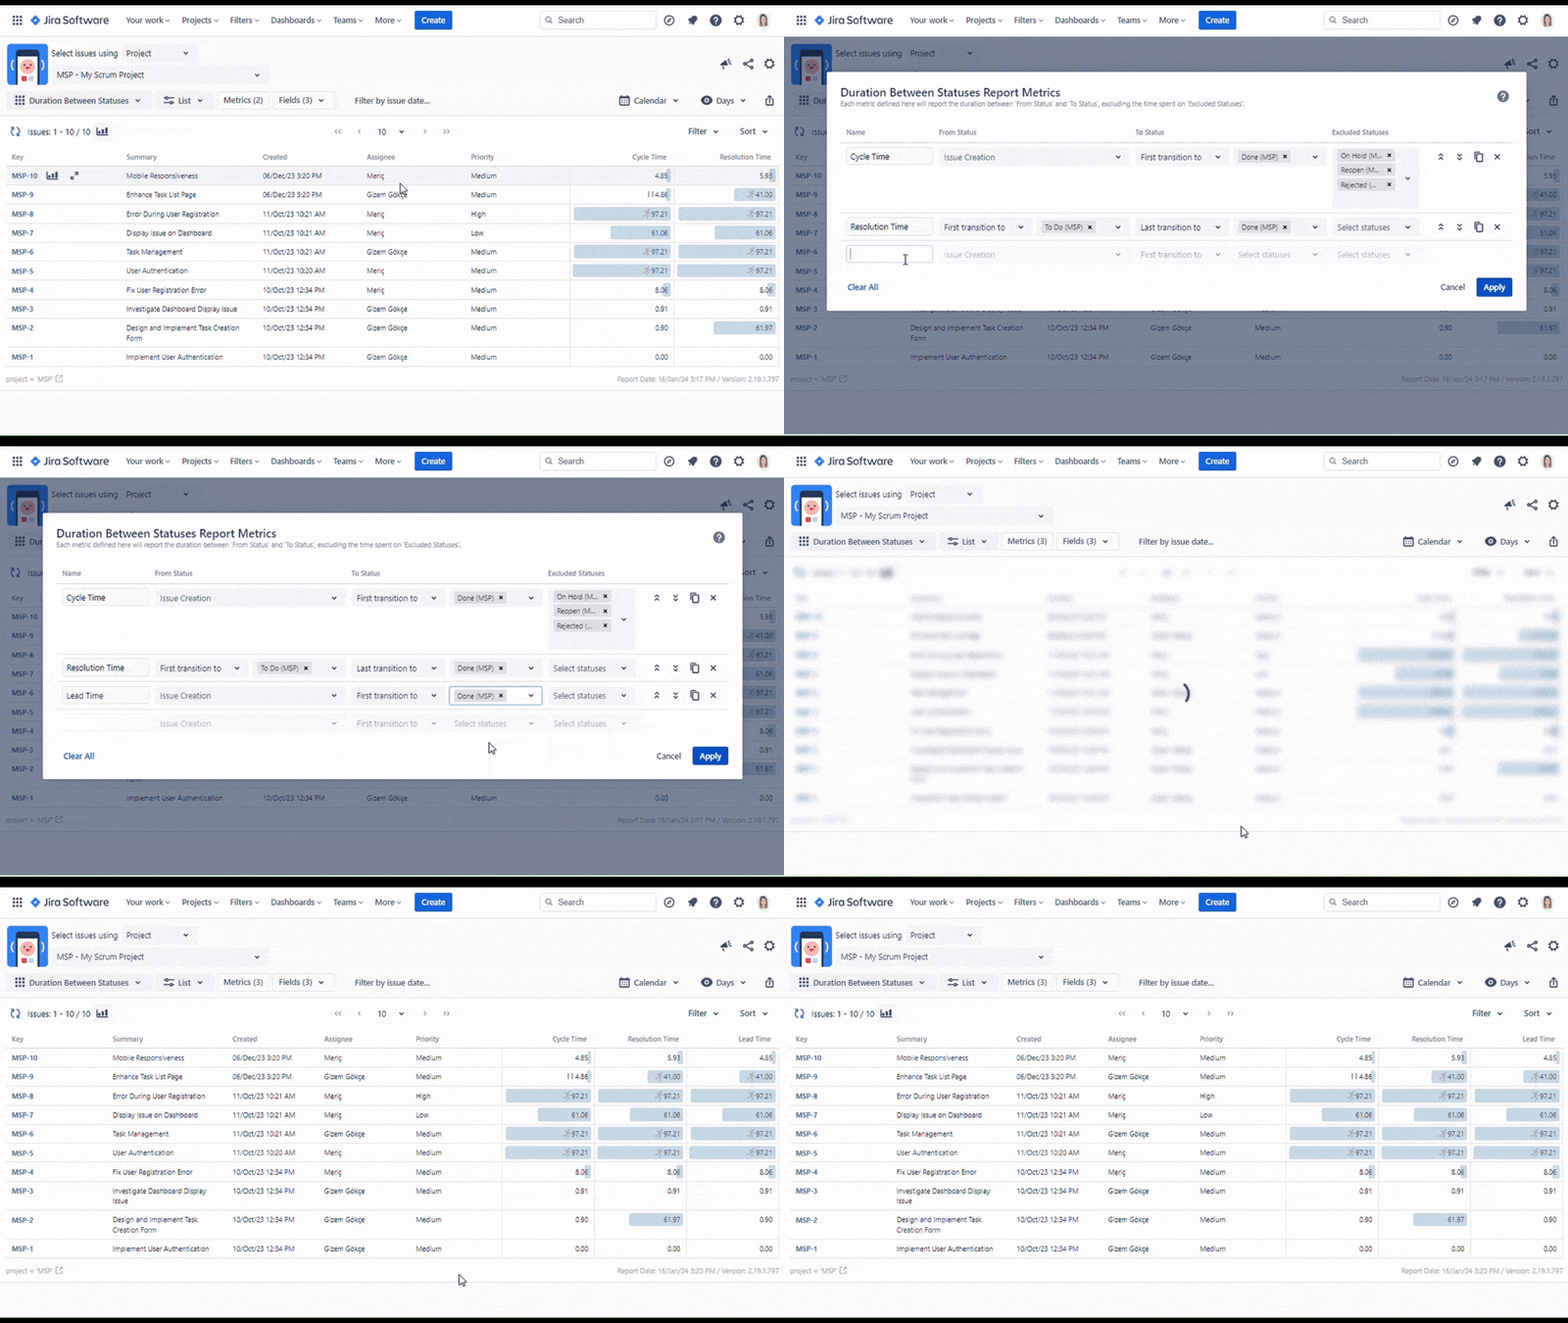
Timepiece provides two types of reports for tracking the above metrics:
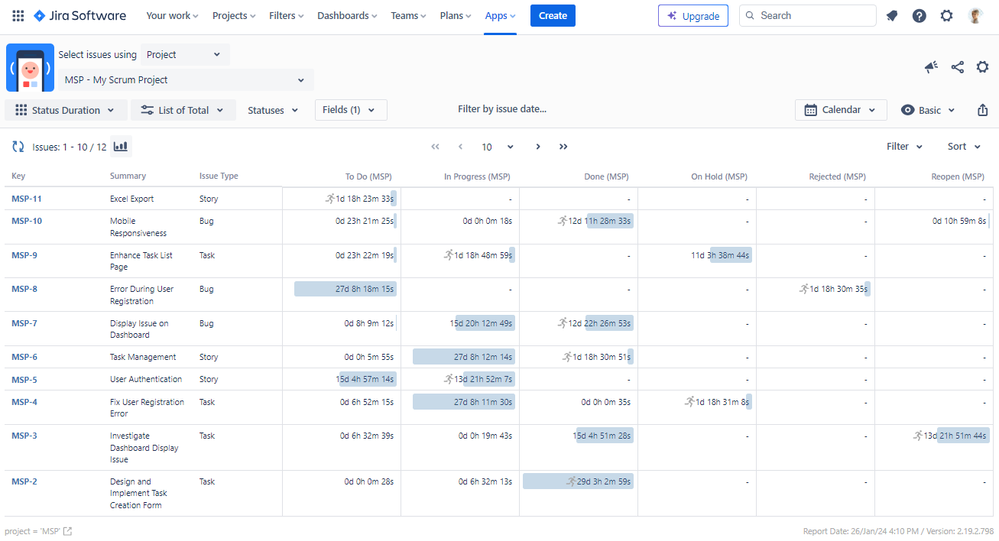
The first is the Status Duration report, which shows how much time each issue has spent in each status.
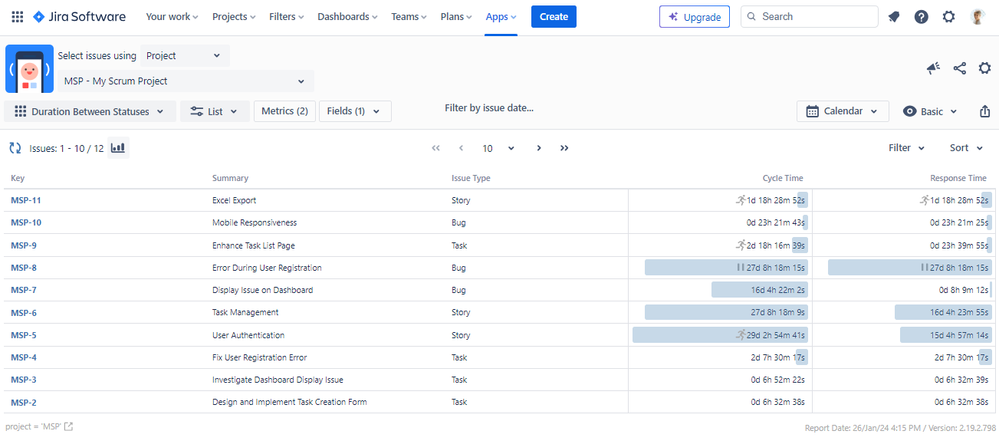
Alternatively, Timepiece also has a Duration Between Statuses report type which shows the duration between two specific statuses.
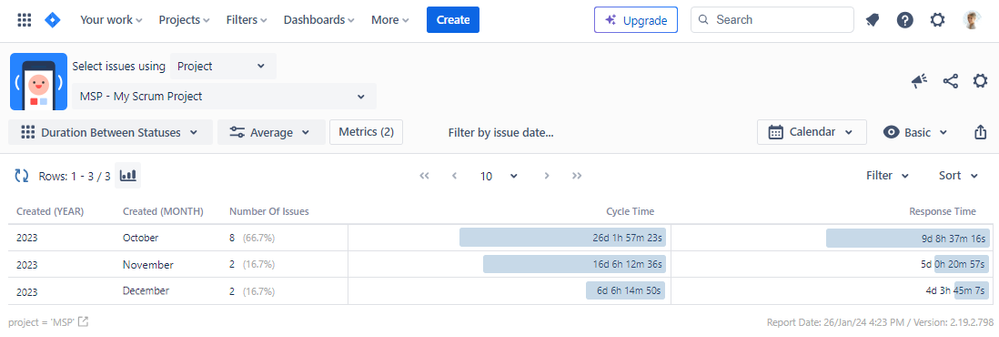
For all numeric report types, you can calculate averages and sums of those durations grouped by the issue fields you select. For example total in-progress time per team or average resolution time per sprint, week, month, issuetype, request type, etc.
When you group the average reports by date fields such as created year or month, you can observe changes in these averages over time and perform a trend analysis.
The app calculates its reports using already existing Jira issue histories so when you install the app, you don't need to add anything to your issue workflows and you can get reports on your past issues as well. Simplicity at its finest!
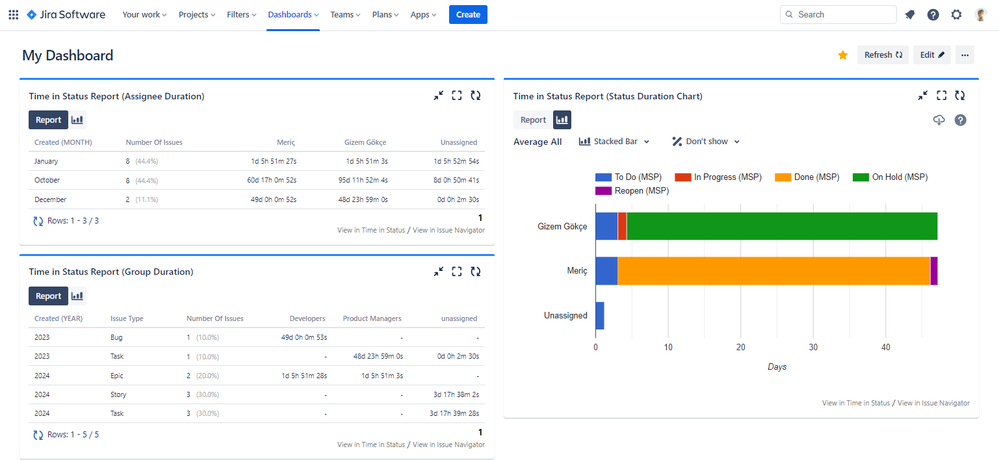
Timepiece reports can be accessed through its own reporting page, dashboard gadgets, and issue view screen tabs, providing both calculated data tables and charts.
Visit Timepiece - Time in Status for Jira to explore how our JIRA add-on can revolutionize your metrics measurement process. Enjoy a 30-day free trial to experience the full range of features. Plus, the app is free for up to 10 users.
In a world where time is of the essence, let our application and JIRA be your allies in achieving optimal performance. Let's make every second count!
Was this helpful?
Thanks!
Gizem Gökçe _OBSS_
4 comments