A pop-up survey could appear while you're here --curious what it's for? Click here to learn more!
×Community resources
Community resources
Community resources
New in Portfolio by HeroCoders: Gantt Charts and Dependencies
Portfolio by HeroCoders gives project managers multiple ways to visualize their teams' work with table, graph, pie chart and tree map views. Now the Advanced Edition of Portfolio goes a step farther, allowing you to view your work as a Gantt chart, complete with dependencies.
Wait, We’re Agile - Why Do We Need a Gantt Chart?
Gantt? Doesn’t that mean waterfall?
Not necessarily. Gantt charts are useful in traditional projects, hybrid projects, and yes even in agile projects. A Gantt chart can compliment your agile board, by showing when work is expected to happen, how items relate, and where risks may appear.
And even if your team is 100% agile, leadership will still want to see a timeline.
Why Use Gantt Charts in Your Jira Portfolio
While there are a multitude of ways to make work visual, Gantt charts remain the go-to tool for showing how planned work relates to time. The new Gantt chart feature relies on the same Jira fields (start dates, due dates, estimates, etc.) used in your Portfolio to create an intuitive timeline that helps project managers accommodate dependencies, identify bottlenecks and forecast releases.
Portfolio’s Jira Gantt chart allows you to:
-
Toggle views – Switch from table to timeline view with the click of a button
-
Add dependencies – Visually link work items and show how they’re dependent (End to Start, Start to End, End to End, Start to Start, Soft) to make the order of operations clear
-
Make instant adjustments – You can easily drag the horizontal bar on the timeline to adjust the dates, and any changes will be immediately updated on the Jira work item.
-
Get the big picture – Like other Portfolio views, the Gantt chart can include work from multiple teams and Jira spaces.
How to Create a Gantt Chart in Portfolio
To view the Gantt chart:
-
From the table view of your portfolio, click on the Gantt chart button in the upper right corner.
-
Enable the Gantt chart toggle.
-
Enter the number of visible days and date range parameters.

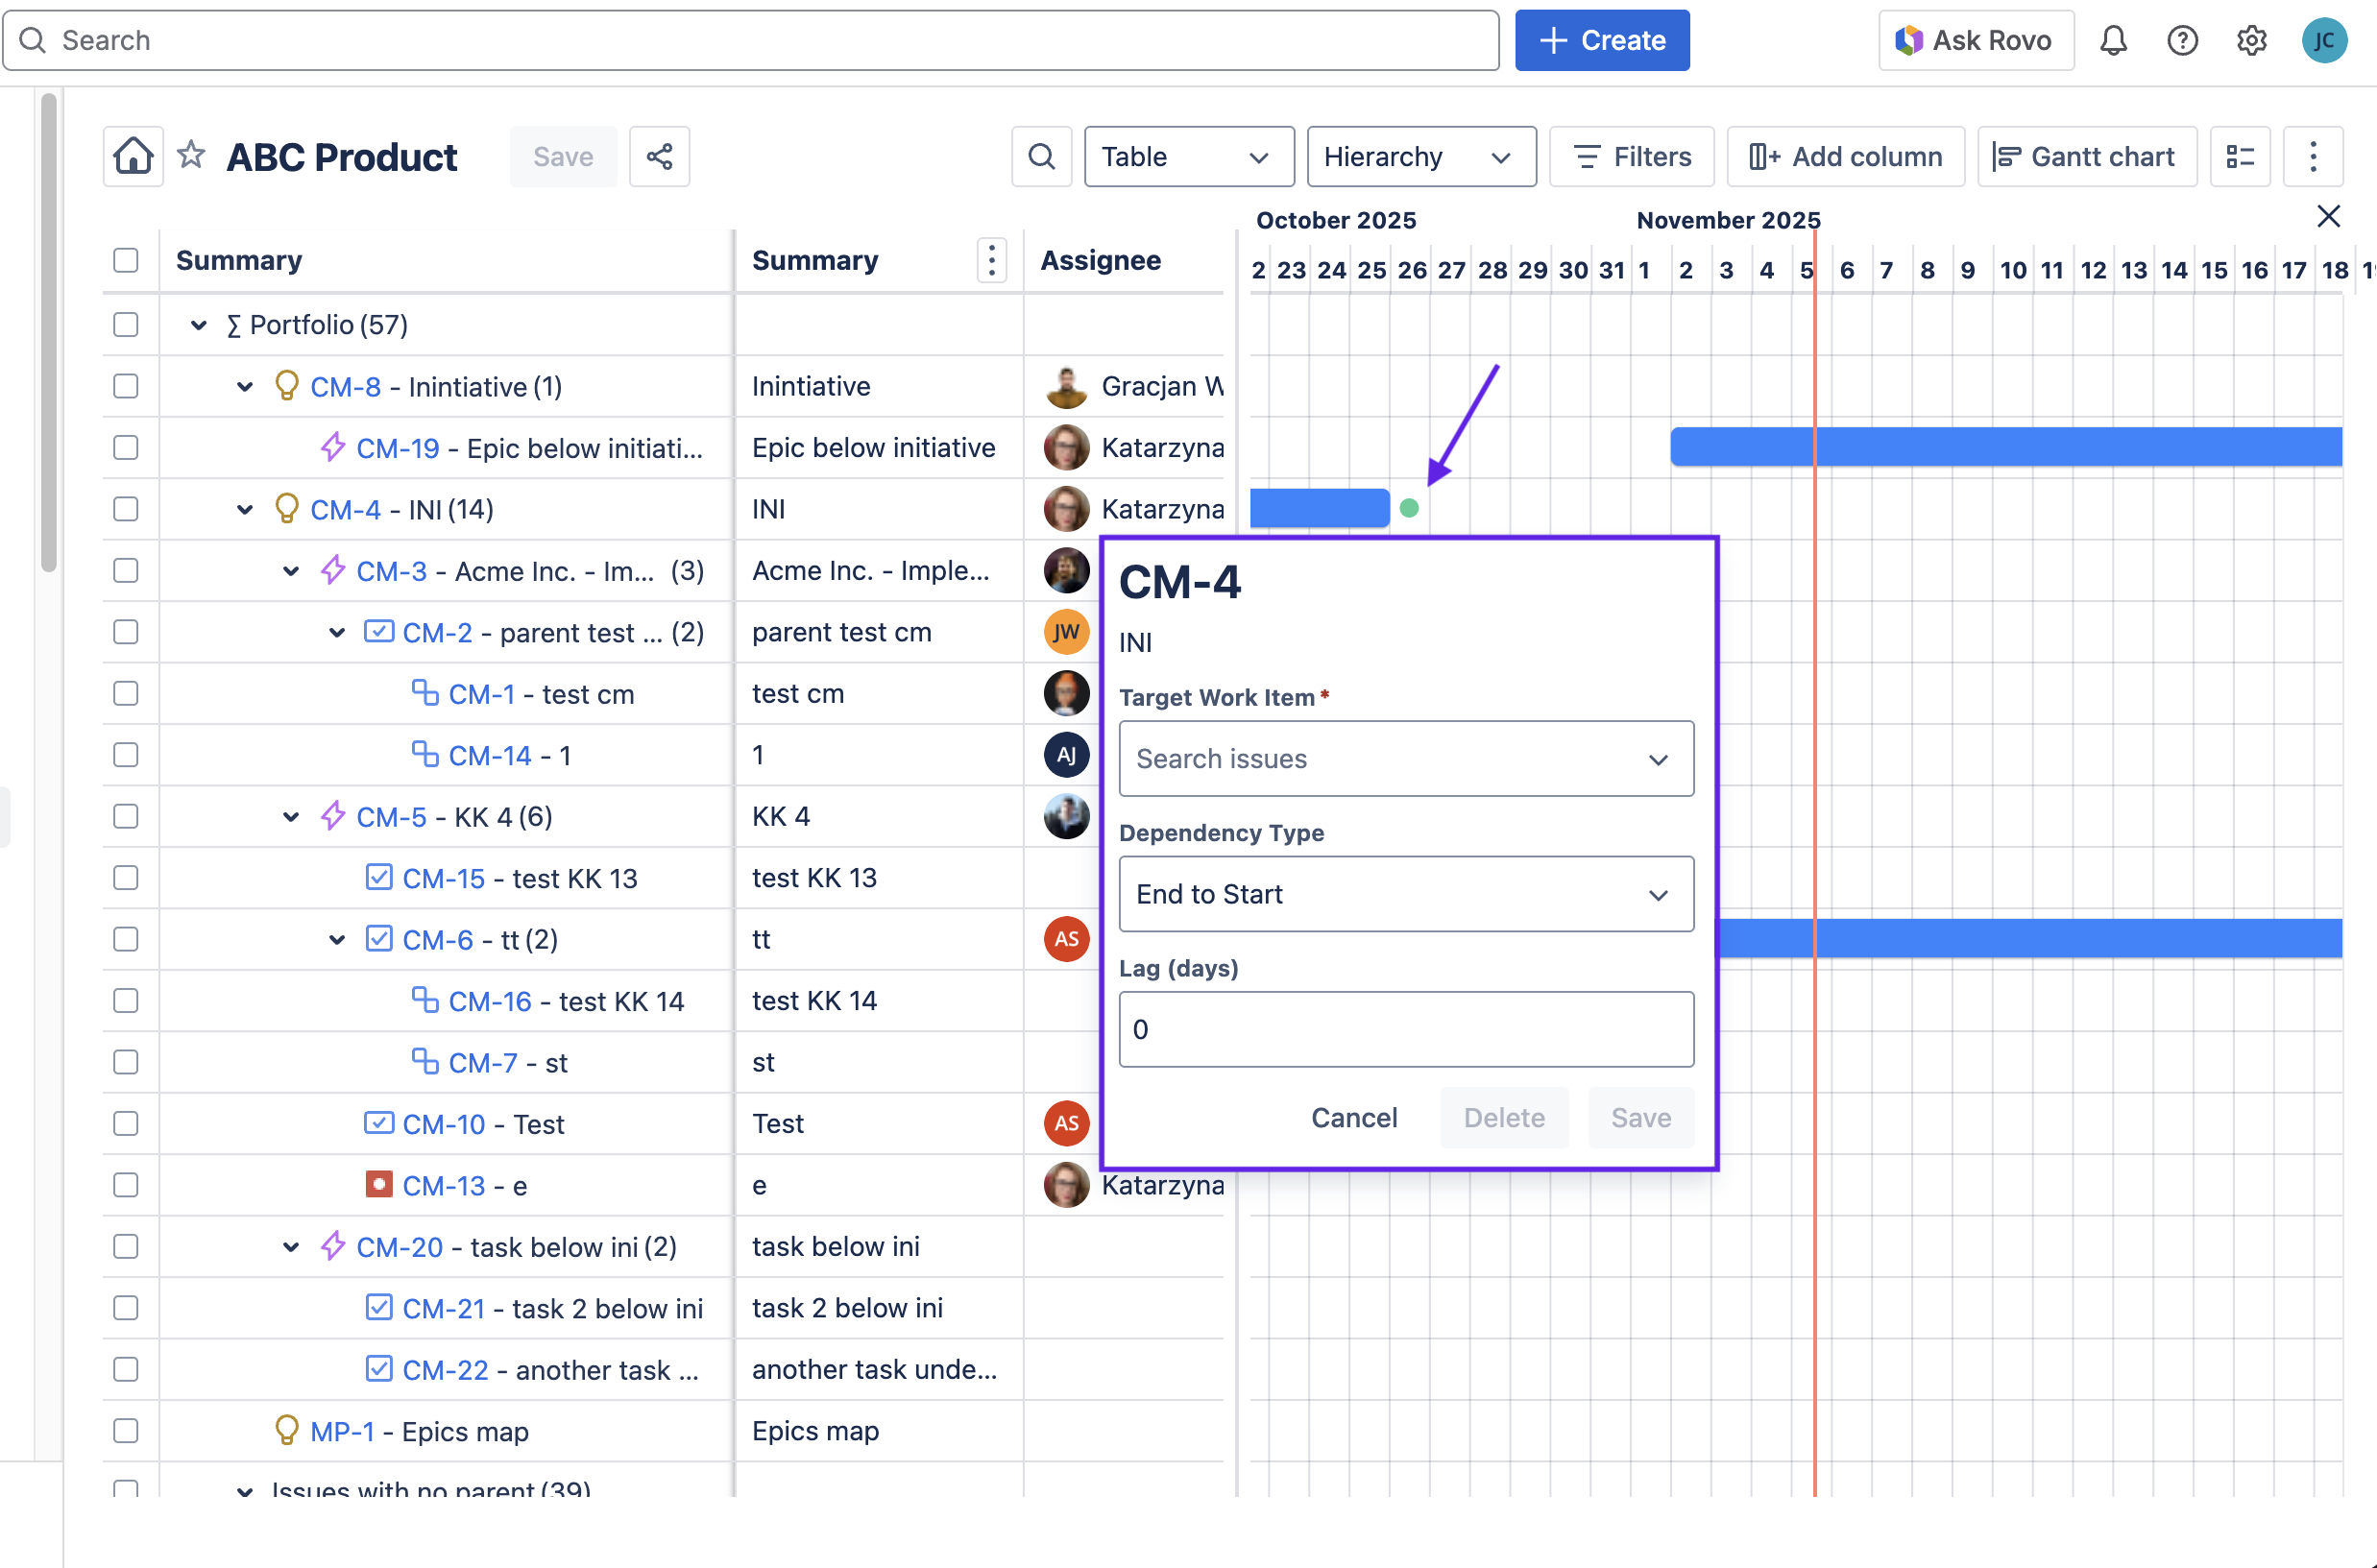
Adding Dependencies in the Gantt Chart
A straight timeline can be deceivingly simple. Sometimes one task has to be finished before another can begin. To create a dependency:
-
Enable the Gantt chart view.
-
Click on the green dot at the end of the work item task bar.
-
A dialog box will open. Complete the fields to create the Dependency:
-
Select the Target Work Item
-
Select the Dependency Type
-
Enter any required Lag time
-
-
The dependency will be displayed as an arrow connecting the work items.

Whether you’re coordinating multiple epics, tracking dependencies, or aligning releases, Gantt charts remain the best tool for visualizing work across time. If you’re already using Portfolio for Jira, then all you have to do is upgrade to the Advanced Edition to add Gantt charts to your suite of PPM options. And if you haven’t tried Portfolio, take a look! You’ll love having multiple ways to visualize your work.
Was this helpful?
Thanks!
Jennifer Choban - HeroCoders
0 comments