Community resources
Community resources
Community resources
The ideal Jira reporting tool: easily optimize team capacities with Report Builder
Do you know which tickets are currently in progress? Who are they assigned to, and how long have these tickets been open? Can you guarantee that no escalated requests are older than, for example, two days? And can you quickly map all these issues into a single report?
You can.
With "Open Tickets Backlog by Status and Days" from the Jira app Report Builder.
This report type from Report Builder is a Scripted Report, which is a report that provides you with numerous custom editing options directly in open-source code using HTML and Java.
Continue reading to learn how to get the most out of the report and optimally assign future issues through a clear view of team capacity.
Reporting made easy: This is what “Open Tickets Backlog by Status and Days” can do
This report does what the name promises: it shows you open tickets from the backlog, arranges them by days and persons working on them. The times when you had to rummage through the queue to see which person in your team is fully utilized and which could still use issue are now over. With this heatmap, you’ll manage to get an ideal overview in no time.
These ticket statuses are displayed:
-
To Do
-
Done
-
In Progress
-
Backlog
-
Selected for Development
The graphical representation of tickets allows you to easily identify escalated and unresolved issues and better manage future issues.
How to quickly view open tickets by date and assignee
Step 1: Navigate to the “Create Report” section of Report Builder. Here you will find an overview of all available report types.
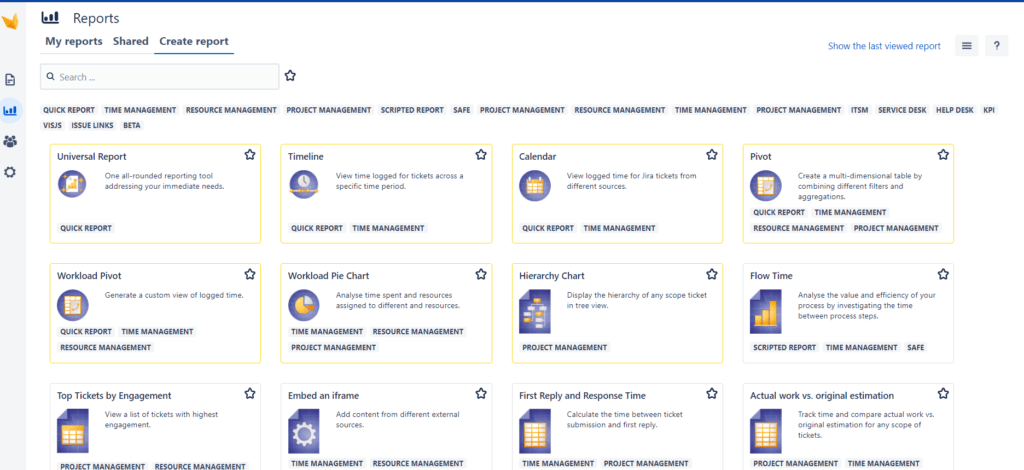
Step 2: Find “Open Tickets Backlog by Status and Days” under the Scripted Reports and click the button to enter the edit mode.
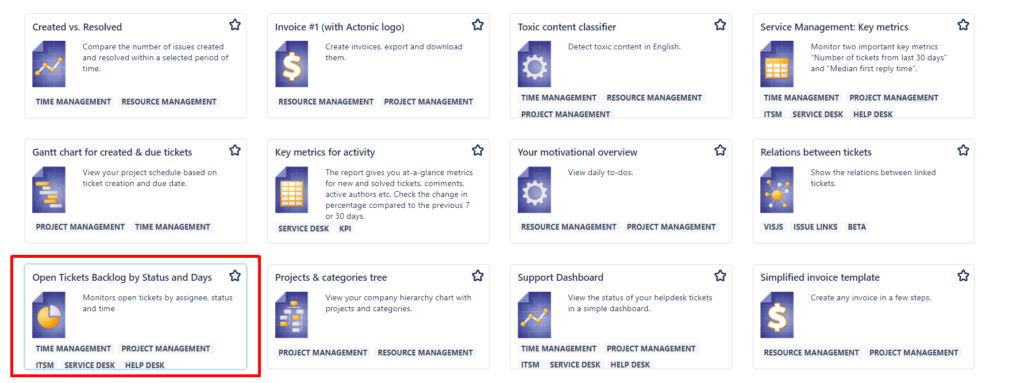
Step 3: At this point, the edit screen is empty. But it will fill up quickly once you have selected users.

Step 4: First, at the “Range Picker” button, you can define the time period to be displayed in the report. You can either do this freely by marking it with the mouse pointer, or you can select predefined times such as “last week” or the “last month” from the list on the right side of the pop-up.
Step 5: Click on the “refresh” button (outlined in red in the screenshot) to view the changes.

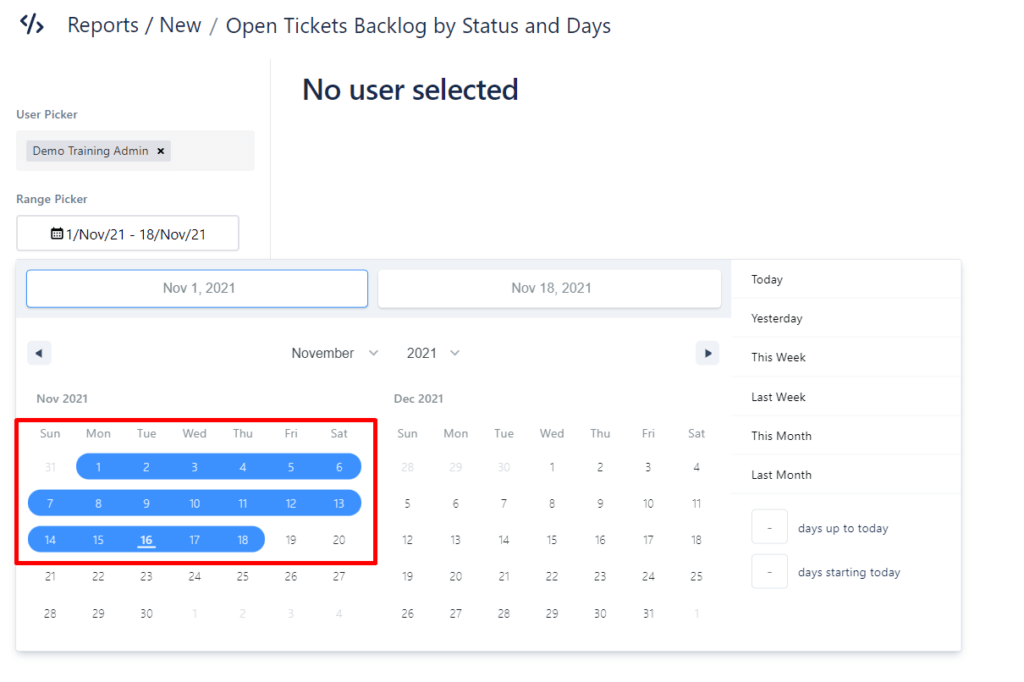
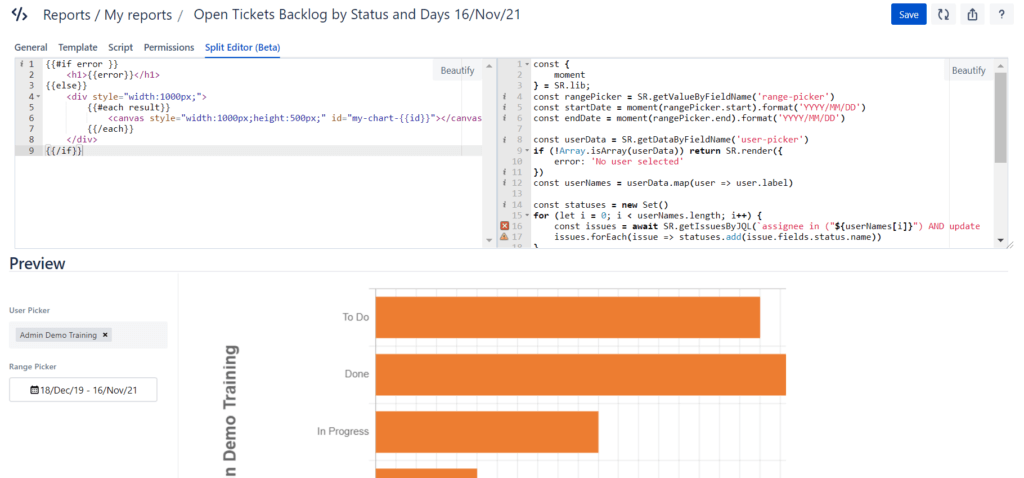
Step 6: A possible output could look something like this:
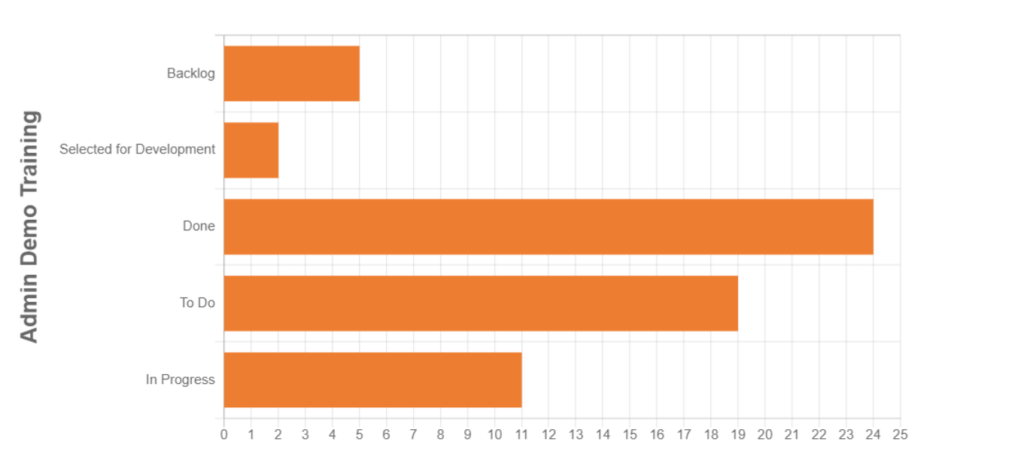
The y-axis shows the status of the tickets. The x-axis indicates the number of tickets.
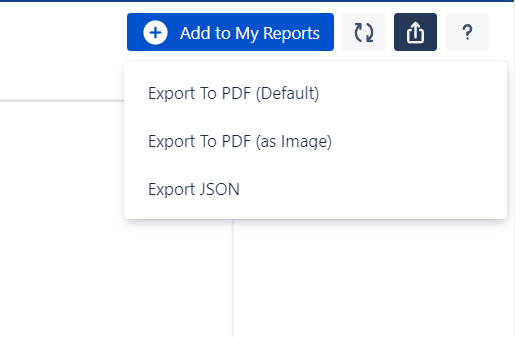
Step 7: When you are satisfied with the selection of parameters, you can conveniently export your report to PDF or JSON by clicking this icon.
Step 8: Since this is a scripted report, you have the option to edit the code directly and make further individual adjustments after saving it for the first time.
Conclusion
Report Builder’s “Open Tickets Backlog by Status and Days” shows ticket performance broken down by the user. At the same time, your overview is ideally granted by self-definable time windows.
This way, you can detect escalated requests and organize your team’s capacity even better in the future. The variable editing of the open-source code is an additional highlight.
No matter how you want to view the assigned tickets, with the Open Tickets Backlog by Status and Days report builder, your requirements are finally met.
Check out our “First Time Response Report”
Was this helpful?
Thanks!
Andreas Springer _Actonic_
1 comment