Community resources
Community resources
Community resources
How to use the Timeline report in Report Builder
Our app Report Builder offers you a wide variety of reports. In order to introduce you to our app and for you to get started, we would like to present some of our reports.
Report Builder differentiates between two types of reports: Quick Reports and Scripted Reports. Scripted Reports are individual reports whose layout and code can be adapted. Quick Reports are ready-made report templates with which you can create quick and easy reports. Today we are introducing one of these reports, the Timeline report.
You can use the Timeline report to display logged times over a defined period. Depending on the selected setting, you can filter by projects, users or epics. The columns of the report represent the individual days.
A practical guide: How to create our Timeline report
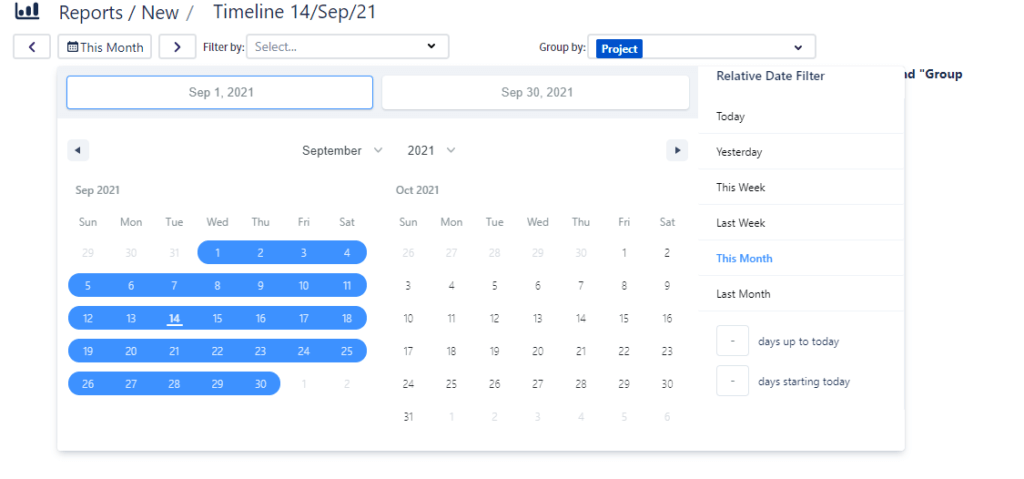
-
Choose a time period for your report.
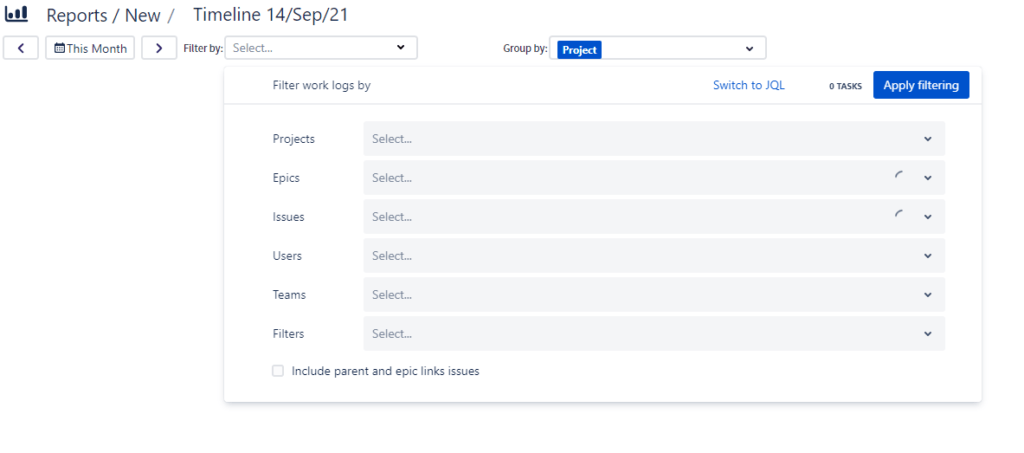
2. Filter settings: Choose the kind of data you want to display in your reports.
3. Grouping: Determine how the data should be displayed by adjusting the field hierarchy.
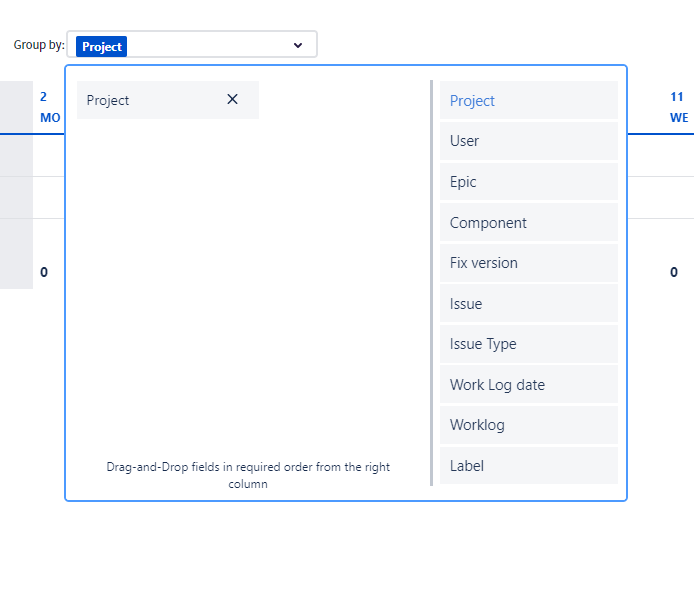
And your report is ready.
When you click on the individual columns of your report, you will see a list of the individual tickets your users worked on this day.

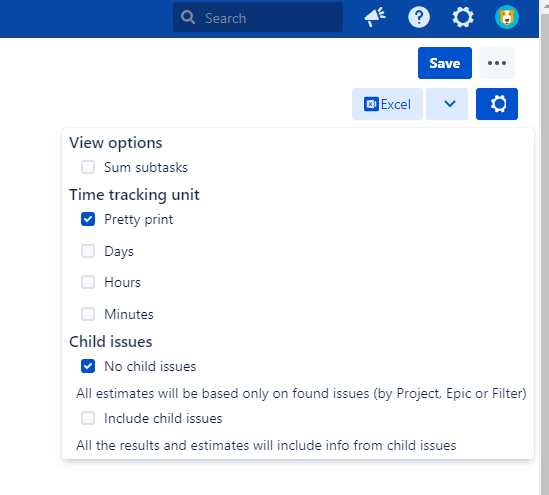
In the top right corner, you can choose between different time tracking units and display the child issues.
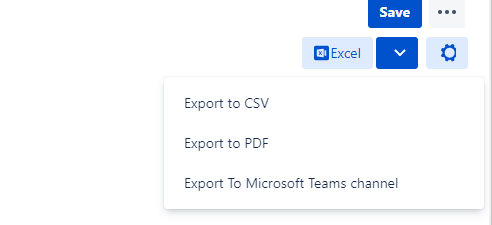
After you have adjusted all the settings according to your requirements, you can export your report. Here you can choose between exporting to Excel, CSV and PDF.
The benefit of this report is to understand your team’s resources by seeing which user has spent how much time on tickets. In addition, you get an overview of when tasks were being worked on and how many resources specific tasks cost.
Would you like to learn more about our reports? Here we introduce you to another quick report: Our Calendar report
Was this helpful?
Thanks!
Andreas Springer _Actonic_
0 comments