Community resources
Community resources
Community resources
How to use Report Builder Flow Time Report
Actonics Report Builder offers a variety of different report types. On the one hand there are the Quick Reports outlined in yellow and on the other hand there are the Scripted Reports. Scripted reports can be customized in the code. Quick Reports are report templates that are already designed for different use cases and provide you with a quick result.
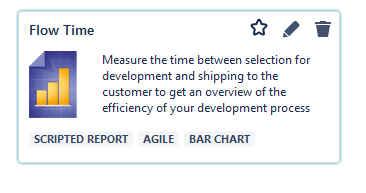
Report Builder's Flow Time Report is a scripted report that helps SAFe Product Owner or Scrum Masters to achieve new efficiency. The Scaled Agile Framework (SAFe) is the world's leading framework for Agile companies. SAFe further helps you improve your workflow, team productivity and product quality. And how? By accurately measuring results, flow, and competence in SAFe.
Thanks to the Flow Time Report you track your company's performance according to individual specifications. In this article, we will introduce you to how to specifically use the report.
Workflow tracking for SAFe Product Owners and Scrum Masters in Jira
What is Flow (Time)?
Flow is a measurement domain in SAFe that controls how efficient a company’s value chain is. Flow Time measures the total time of all steps in a workflow. Usually, the measurement starts at the time of brainstorming for the idea and continues all the way to production. However, in some cases it is more useful to determine the flow time for specific steps of a workflow.
In this way, you can accurately track specific workflows and then compare them with each other. The shorter the flow time, the lower the cost of potential delays that can occur.
Actonic’s Flow Time Report
To help you focus on what’s important in your company, Actonic has created the Flow Time Report. This report measures time for you and provides the results in a visually appealing form.
Our Flow Time Report can
-
Calculate the average amount of time it takes to complete a task
-
Calculate the average flow time for each task
-
Identify development deviations
-
Display the output in a histogram with work items
To help you enjoy the full benefits of Report Builder Flow Time Report, we have prepared a step-by-step guide for you.
How to create your own Flow Time Report
1. Navigate to Report → Create Report → Scripted Reports → Flow Time→ Flow Time
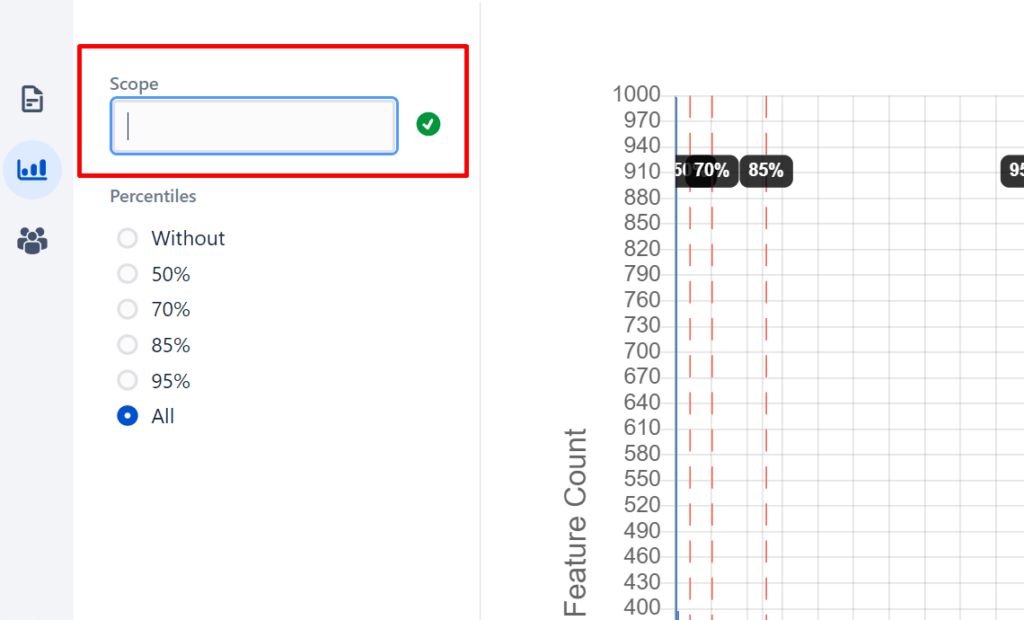
2. In the report itself, you have the option to define a scope. In this field, you can use JQL (Jira Query Language) to flexibly search for desired operations. In this way, you can quickly obtain information in a simple and extended manner, just as you wish. Here you will find an overview of the JQL syntax.
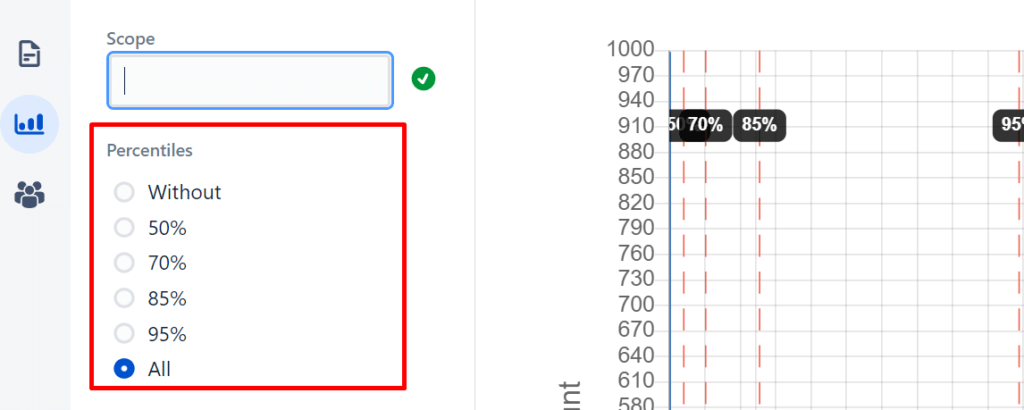
3. For Percentiles, select a percentage value to better estimate the distribution of flow time. Percentile values are commonly used in statistics to indicate the percentage of observations below which a selected group or operation falls.
Percentile values are particularly useful when you want to interpret results in relation. For example, if you know that you scored 83 out of 100 on a test, that number does not tell you how well you did compared to other participants. If the score shows you that yours is in the 90th percentile, it means that you did better than 90% of the other participants.
So select the desired percentile here to put the numbers in a meaningful relation.
4. After you set the filters, you will see an output similar to this:
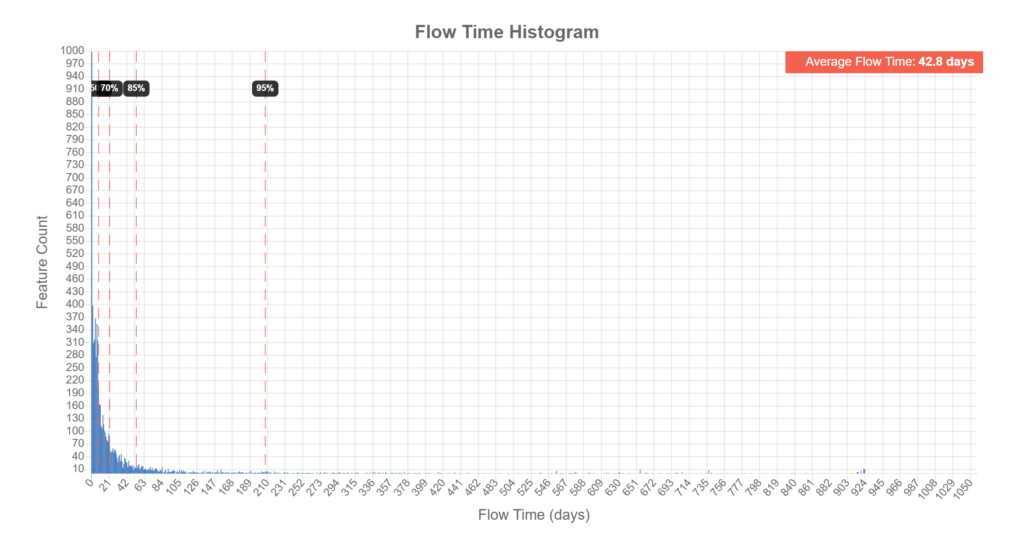
On the x-axis of the Flow Time chart you can see the days that you have defined as a time period. The interrupted red lines are the percentile values. The y-axis shows the number of tracked operations (features) that fall within the time frame.
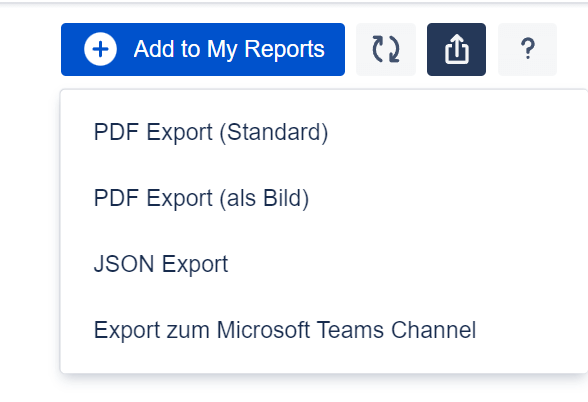
5. Lastly, you can export the created report to PDF, JSON or to Microsoft Teams.
6. After exporting, you have the possibility to view the HTML code of your report and customize it according to your requirements. To do this, go to the “Template” tab and edit the code individually.
Conclusion
This tutorial has shown that you can use Report Builder Flow Time Report to track your workflow very individually and thereby increase your efficiency. SAFe Product Owner and Scrum Master can evaluate sprint development thanks to the measurement, identify outliers in the process and reduce the overall flow time as a result.
Was this helpful?
Thanks!
Andreas Springer _Actonic_
0 comments