Community resources
Community resources
Community resources
- Community
- Products
- Apps & Integrations
- Questions
- How to show logged time in two dimensional filters or pie charts on the dashboard
How to show logged time in two dimensional filters or pie charts on the dashboard

We have a time logger that records the time a developer works on an issue. This logger reports the time logged to the Time Logged field in the issue.
What I would like to do, is to get a Dashboard pie or two dimensional filter to show me the amount of time each of my developers spent on solving bugs. However, Time Logged doesn't appear as an option in the two dimensional filter or pie charts.
Help appreciated.
2 answers
1 accepted

Hi @Adi Lerner
Welcome to the community.
Since worklog doesn't have a pre-defined list (such as; single select), you can not give as an input to pie chart or two dimensional chart.

Seems a pretty basic function for a Team Leader to want to know...
You must be a registered user to add a comment. If you've already registered, sign in. Otherwise, register and sign in.
Welcome to the community, @Adi Lerner.
I am Marlene from codefortynine.
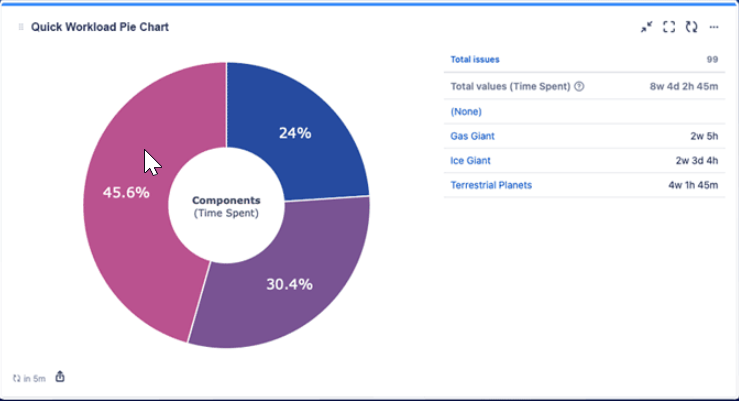
With our Jira cloud app Quick Filters for Jira Dashboards you can sum up time spent (and other number fields) and display it on your Jira dashboard.
In the example below the two-dimensional filter statistics gadget is shown per assignee and component, but of course other issue fields are possible.
Update 2023-06-15: It is now also possible to display workload statistics on our Quick Pie Chart gadget
You can check out our basic features of our app without installation on our demo dashboards.
You must be a registered user to add a comment. If you've already registered, sign in. Otherwise, register and sign in.

Was this helpful?
Thanks!
- FAQ
- Community Guidelines
- About
- Privacy policy
- Notice at Collection
- Terms of use
- © 2024 Atlassian


You must be a registered user to add a comment. If you've already registered, sign in. Otherwise, register and sign in.