Community resources
Community resources
Community resources
How to set up custom reports in Report Builder
Our smart solution for reporting in Jira
Planning, execution, and delivery of projects are essential tasks in project management, and competent project managers are the ones that can track the project execution and time. The agile software Jira by Atlassian is very popular among project managers, enables you to master those tasks efficiently, and effectively and offers opportunities to track time resources.
The Atlassian ecosystem offers a valuable solution for planning and delivering projects with Jira: Report Builder. This Jira reporting tool helps your projects track time, plan your progress and resources, and invoice your client. A particular highlight of this time tracking app is its function to create custom reports via HTML and JavaScript.
In this article, we will show you the custom reports function through practical insights. Then, we will demonstrate how to quickly set up custom reports with our Report Builder app in five simple steps.
-
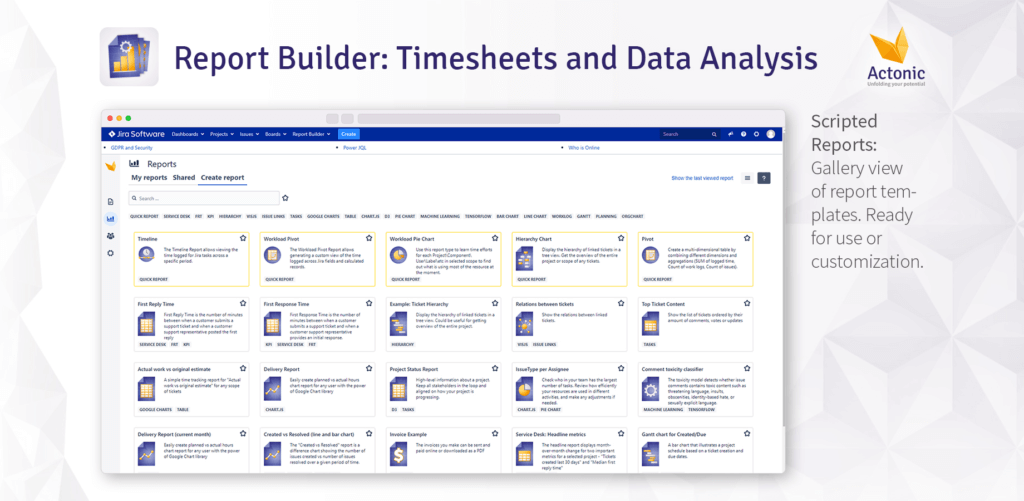
Step 1: Choose your desired Scripted Report
You can view the Report section by clicking on the “reports” symbol in the toolbar at the left-hand side of your screen, then click on “Create report”. You can view all the reports you can create using the Report Builder app on this page. The yellow outlined reports are “Quick Reports,” these are predefined report templates with visualization libraries. The gray outlined reports are “Scripted Reports,” these will allow you to customize your Jira reports individually via HTML and JavaScript. Select your desired “Scripted Report” here.
Step 2: Choose your desired report parameters
You have a wide variety of scripted reports to select from, such as project status report, GANTT chart report, lead time report. In this article, we will use the “Created vs. Resolved” report as an example to illustrates the relationship between created and resolved Jira tickets.
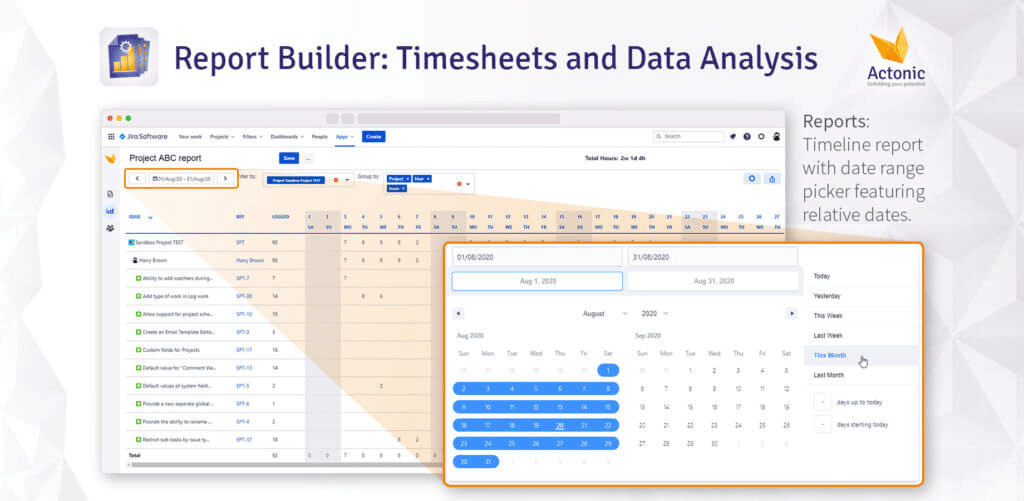
You can visualize how your productivity has changed in a bar- or line graph and determine if you achieved your goals. The report uses JQL filters and the time frame selected, and you can choose the relevant timeframe in a calendar view:
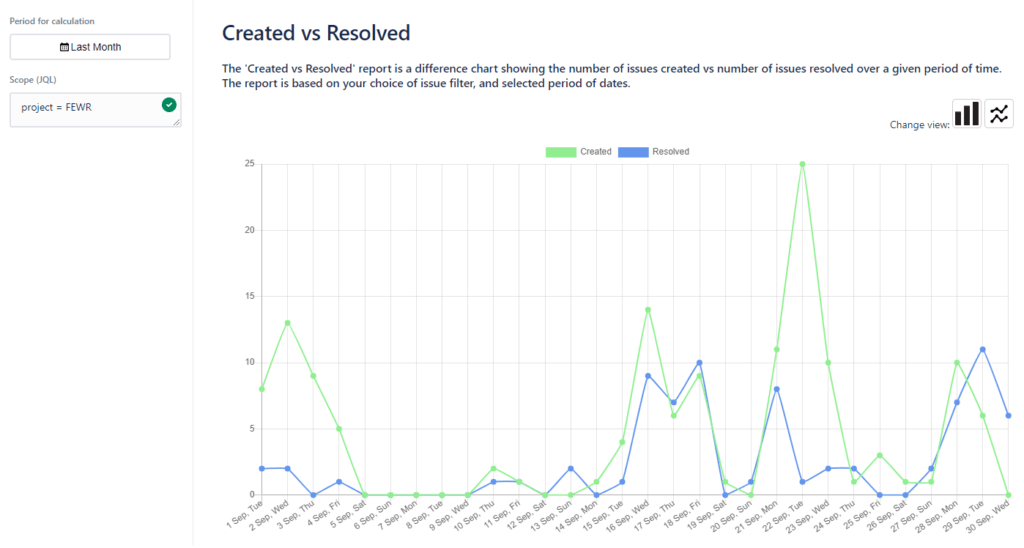
Furthermore, you can limit the number of tickets included in the report using JQL in the input box “Scope (JQL).”
The chosen tickets are the basis of the report. The report compares the number of created (green) and resolved (blue) tickets in your desired time frame via a bar- or a line graph.
The „Created vs. Resolved“ report in Report Builder as a line graph:
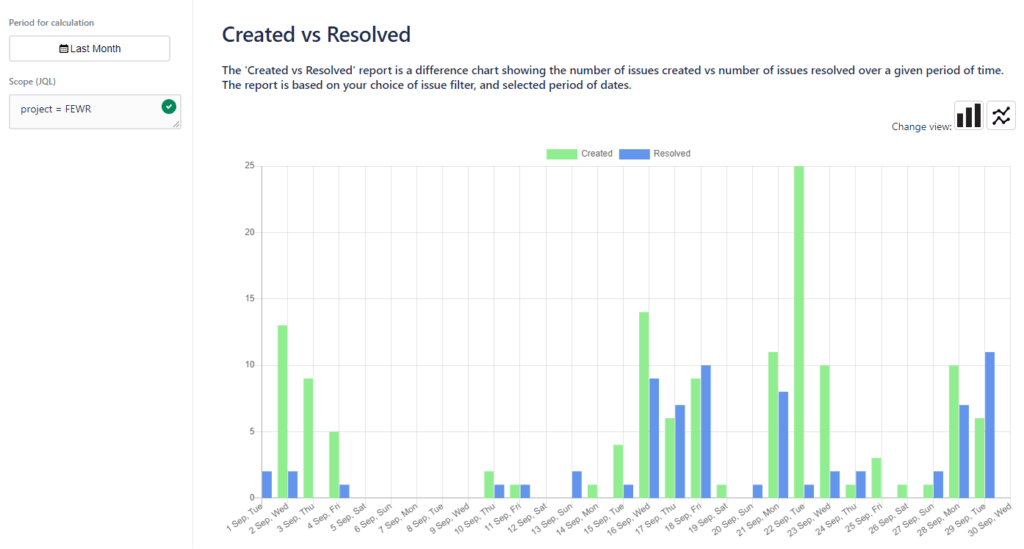
The „Created vs. Resolved“ report in Report Builder as a bar graph:
Step 3: Save the report and select it in “My reports”
When you select your data and create the report, you can add it to the “My reports” section by clicking on the “Save” button located at the right top of your screen. You can select your reports saved under “My reports” and click on “Edit” at the top to get the following view:
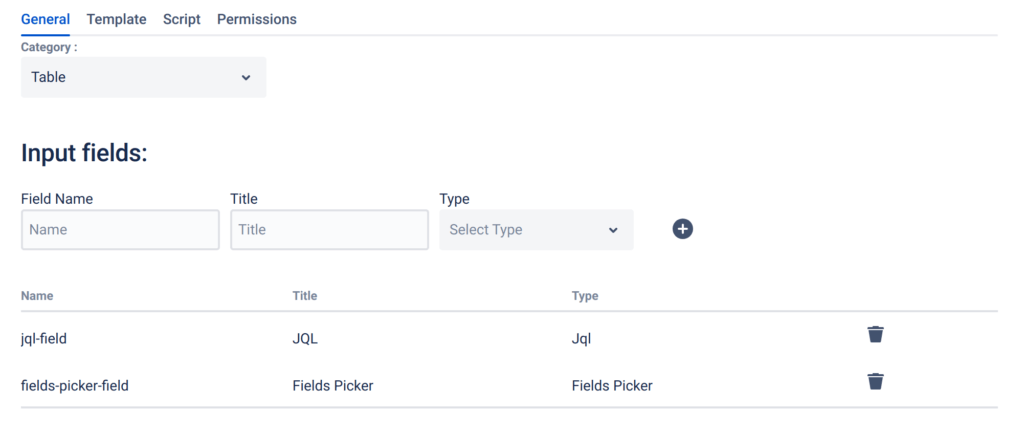
Step 4: Adjust your custom report via HTML or JavaScript
Choose the “template” tab at the top. You can now see the HTML code on which the report was built and adjust it based on your criteria. You can change the design and the displayed information. The preview section shows you how the modified report will look.
By clicking on the “Script” tab, you can edit the underlying JavaScript code and design your report via JavaScript based on your individual needs.
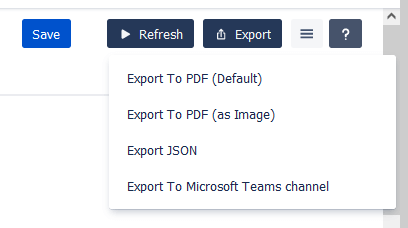
Step 5: Export your report
When you click on the “Export” button at the top right, you can export the report as PDF, JSON, or a Microsoft Teams channel. Now you can use the created report to analyze your project management.
Report Builder is our “Swiss Army knife” of reporting in Jira that enables you to create every report you might ever need!
Was this helpful?
Thanks!
Andreas Springer _Actonic_
0 comments