Community resources
Community resources
Community resources
How to track the team velocity / throughput in Kanban with Great Gadgets app for Jira
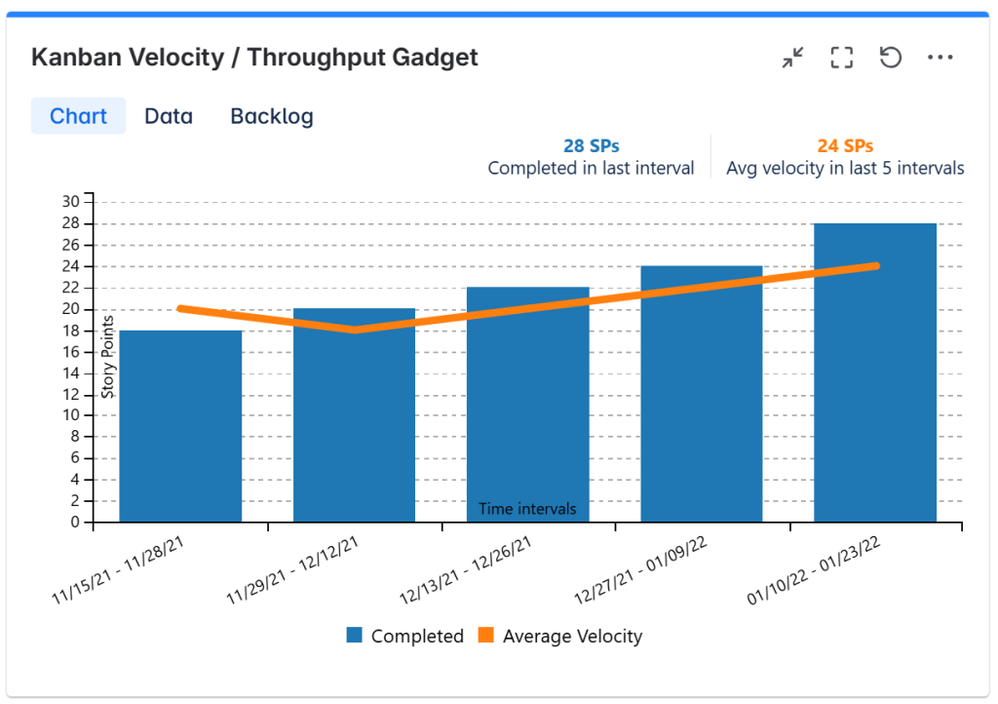
"Tracking team velocity in Kanban" might sound strange for some people as velocity is something specific to the Scrum framework and this term is not part of Kanban "by-the-book". But even in Kanban, especially when switching from Scrum to Kanban, the question "How much business value my team delivers in time?" is still applicable. In Kanban, the velocity is actually called "throughput". As an agile project manager or a team member, you want to see the amount of work done/delivered by your team in time, to see how the team performs or to make a better picture about the team's capacity that helps you to estimate further releases.
In Kanban you don't have time-boxed sprints, but you can measure the velocity / throughput on a per-week or per-month basis, by issues (cards) done or story-points burned. For example, "done issues per week" or "burned story-points per month".
Great Gadgets for Jira & Confluence offers all you need to easily determine your team velocity / throughput. This app includes a Kanban Velocity gadget that helps you calculate and display a velocity chart on a Jira dashboard in a minute.
Assuming that you already have Atlassian Jira in-place, follow these steps to configure and display the Kanban Velocity gadget:
- Make sure that you have the latest version of Great Gadgets installed in your Jira instance. If not, you can install the app from Atlassian Marketplace.
- Create a new filter in Jira (or use an existing one) that includes the Jira issues (tasks, stories, defects, etc) from your project. Make sure to include the sub-tasks in this filter if you want the velocity calculation to also consider the sub-tasks. Share this filter with your project members or the people that are going to visualize the velocity chart.
- Decide on which Jira dashboard you want to add the Kanban Velocity gadget. Create a new Jira dashboard or choose an existing one.
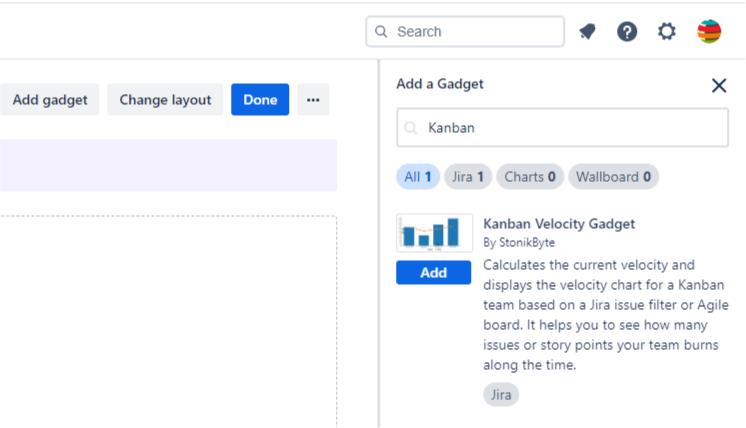
- Add the Kanban Velocity gadget to your Jira dashboard by clicking the Add Gadget button from your dashboard and then by selecting and adding the Kanban Velocity Gadget.
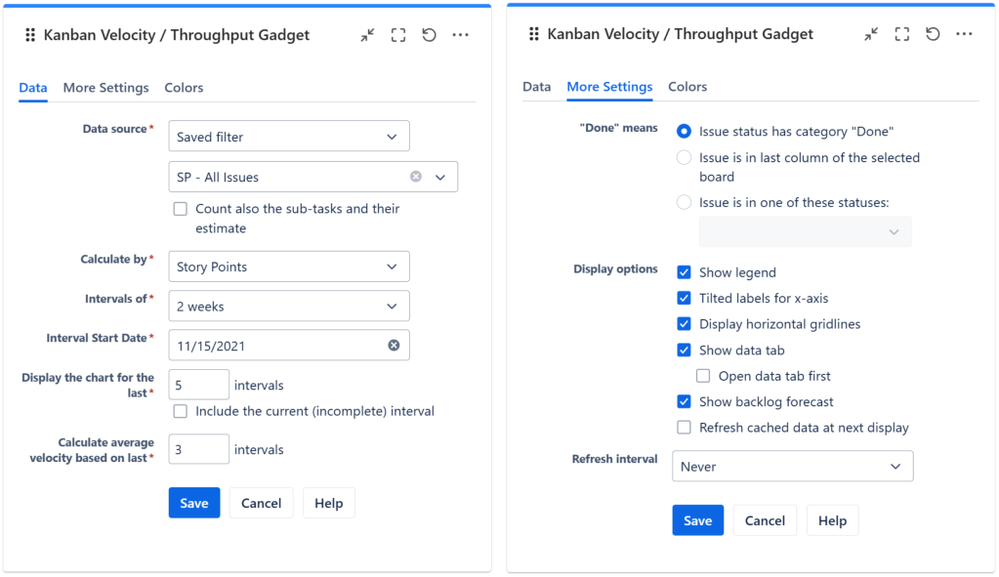
- Configure the gadget. Even if most of the settings are preconfigured, review and adjust them based on your needs. At Data source, enter the filter that you created before or pick an existing Kanban board (the board's filter will be used in this case). As you can see, the Interval length is configurable and you can choose to calculate the velocity by Issue Count, Story Points, Original Time Estimate or by any numerical custom field defined in your Jira instance. Optionally, you can choose to count also the sub-tasks and their estimate in the velocity calculation.
That's all! Click Save. The gadget should now display the velocity chart for your Kanban team.
Bonus features!
- If you check "Show data table" in the More Settings tab, it will display a Data tab with a velocity / throughput report that you can easily export in CSV format.
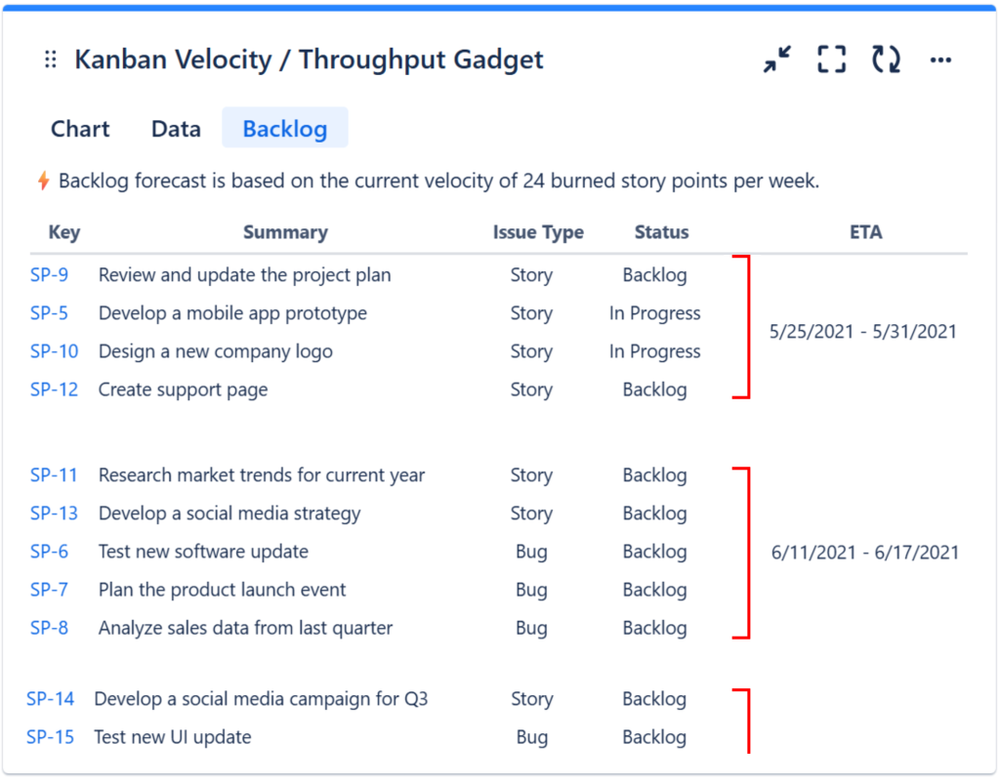
- If you check "Show backlog forecast" in the More Settings tab, the gadget will display a Backlog tab with your backlog items along with their ETA calculated automatically based on the current velocity. This could help you answer the difficult customer's question "When will my problem be solved?".
If you have questions, don't hesitate to contact support@stonikbyte.com.
Was this helpful?
Thanks!
Danut M _StonikByte_


4 comments