Community resources
Community resources
Community resources
- Community
- Q&A
- Jira Service Management
- Questions
- MTTA and MTTR Tracking and Reporting
MTTA and MTTR Tracking and Reporting
I am looking for any addons or automation or API ways to complete these types of tracking. We are looking to track this data for every ticket within our JSM. Additionally, we only want MTTA/MTTR tracked on specific ticket types. Any help would be super appreciated.
3 answers
Hi, Jay. Jira Service Management natively allows tracking MTTA (Mean Time To Acknowledge) and MTTR (Mean Time To Resolve).
Have you tried this and are not finding it adequate? Or, maybe you did not know this?
Best,
-dave
But´s possibly create a report or query from API where MTTA and MTTR of alerts is calculate only in comercial time.
You must be a registered user to add a comment. If you've already registered, sign in. Otherwise, register and sign in.
Hi @Jay,
Your best option here is our Great Gadgets app, which allows you measure MTAA and MTTR and display it in various ways.
As Control Chart - displays issues by their cycle time (MTTR or MTAA in your case) in a plot diagram for a certain time period. It display average and allows you to set a threshold to easily identify the ones (red-colored) that took longer than expected.
You will be able to see MTTR for individual issue, by hovering the mouse over them.
As Trend Chart - displays the average cycle time (MTTR or MTAA in your case) for past time intervals along with a linear or polynomial trend line and the overall average.
As Histogram Chart - displays the distribution of the cycle time (MTTR or MTAA in your case) and shows how many issue took longer than expected.
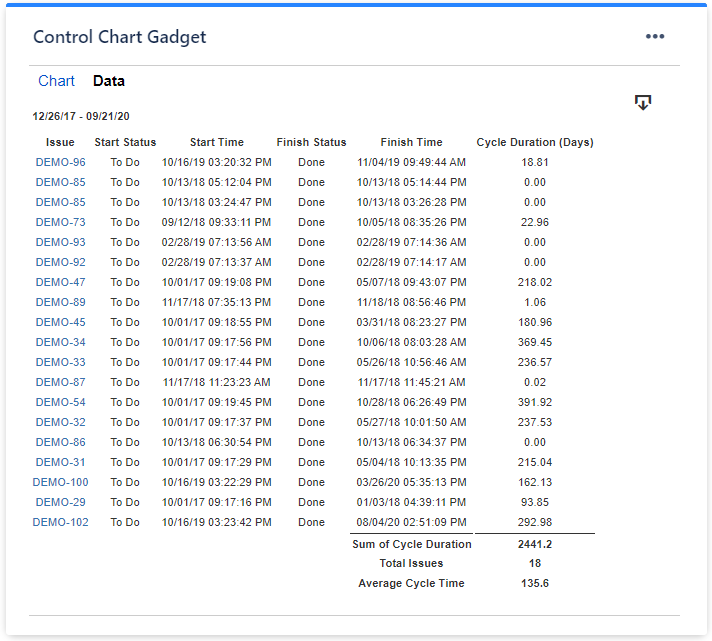
In addition, these charts can display a Data tab which contains a detailed report with all the issues.

Have a look over this article: https://community.atlassian.com/t5/App-Central/An-effective-dashboard-for-Service-Desk-and-Customer-Support/ba-p/2360369
In sections 3 and 4 you will see the complete solution for tracking metrics like MTTA or MTTR by using the gadgets offered by our Great Gadgets app. As you will see, the app lets you track many other useful metrics.
You could start with 1-month of free trial. If you need any help, please contact us at support@stonikbyte.com.
Hope this helps.
Danut
You must be a registered user to add a comment. If you've already registered, sign in. Otherwise, register and sign in.
It´s possibly create a report where MTTA and MTTR of alerts is calculate only in comercial time in Opsgenie.
You must be a registered user to add a comment. If you've already registered, sign in. Otherwise, register and sign in.
@Jay -
Out of the box, have you already look into setup/configure SLA for your JSM projects, where SLAs should be able to provide you with the data that you needed.
Otherwise, you can take a look at Scriptrunner for Jira to create custom calculated fields with scripting setup. Once the fields are created, then you can make them available to your JSM project's issuetypes/field context.
https://marketplace.atlassian.com/apps/6820/scriptrunner-for-jira?tab=overview&hosting=cloud
Hope this helps.
Best, Joseph Chung Yin
You must be a registered user to add a comment. If you've already registered, sign in. Otherwise, register and sign in.
But´s possibly create a report or query from API where MTTA and MTTR of alerts is calculate only in comercial time to Opsgenie.
You must be a registered user to add a comment. If you've already registered, sign in. Otherwise, register and sign in.


You must be a registered user to add a comment. If you've already registered, sign in. Otherwise, register and sign in.